XRP, VeChain, FTX Token Price Analysis: 14 October

XRP had formed a bullish pattern but was rejected and the pattern invalidated as the asset looked to be headed south. VeChain appeared to have lost a level of support it had held tenuously over the past few days. FTX Token surged to reach a level of resistance after breaking out of a month-long downtrend
XRP

Source: XRP/USD on TradingView
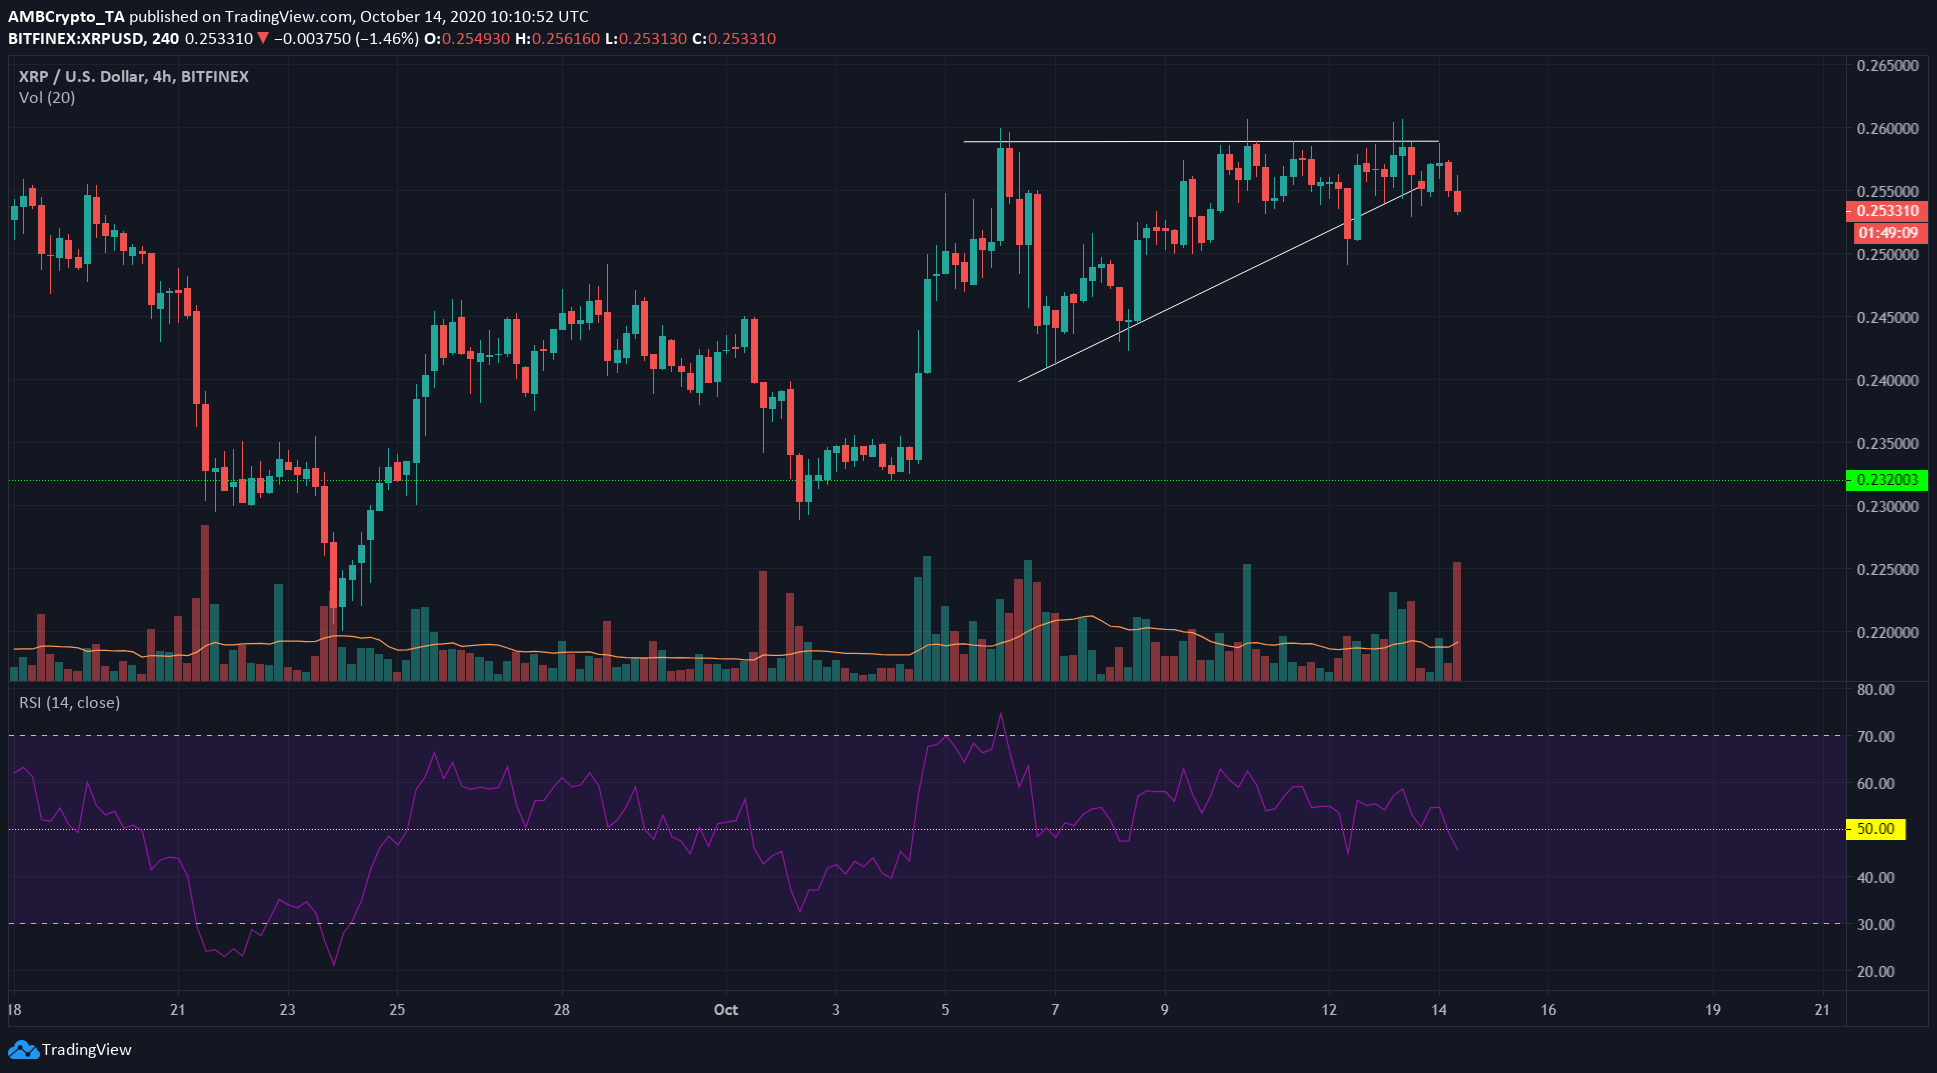
XRP had formed an ascending triangle, a pattern that generally sees the asset break out to the upside. However, in this case, XRP was rejected at $0.258 which was the pattern’s top, and at press time broke beneath the ascending trendline.
The break beneath the pattern invalidated the bullish setup. The RSI also showed a dip toward bearish momentum with a value of 44 and headed lower.
The drop also happened in a trading session with good trading volume, validating the move. The next level of support lies at $0.232, which was 8% lower than where the asset was trading at. A zone of support at $0.245 was also seen.
In other news, participants of a survey polled that XRP would reach $100. That would see XRP command a market cap of $4.5 trillion. For context, the GDP of Great Britain was valued at $2.86 trillion in 2019.
VeChain [VET]

source: VET/USD on TradingView
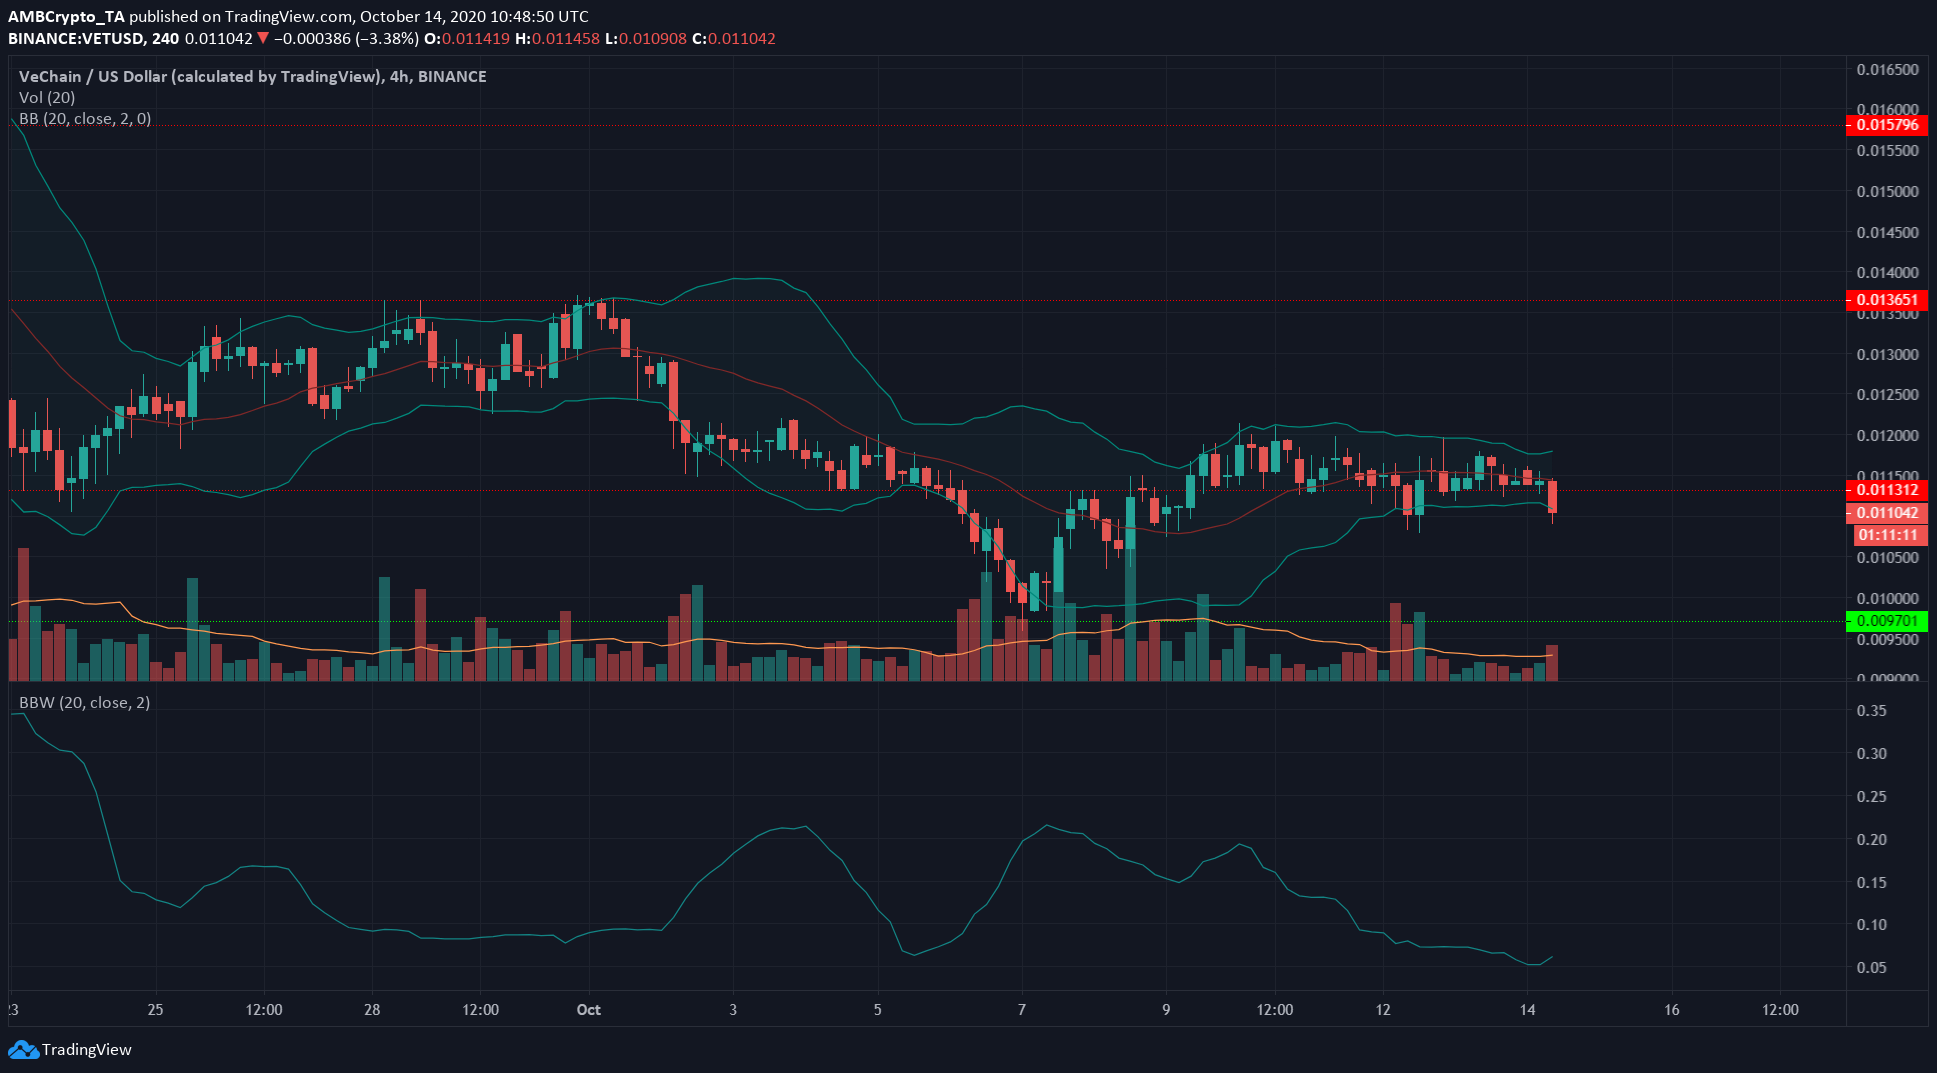
VeChain had bounced off support at $0.0097 and reclaimed level $0.011 as support. Yet, at press time, the price appeared to be headed lower.
The Bollinger Bands had been quite tight around price over the past few days, the tightest in nearly a month but looked to be widening as the price dove beneath support. The trading volume was also above average and rising.
This breakout, if VET closed beneath the level of support, could see it reach $0.01 or $0.0097 in the coming days.
FTX Token [FTT]

Source: FTT/USD on TradingView
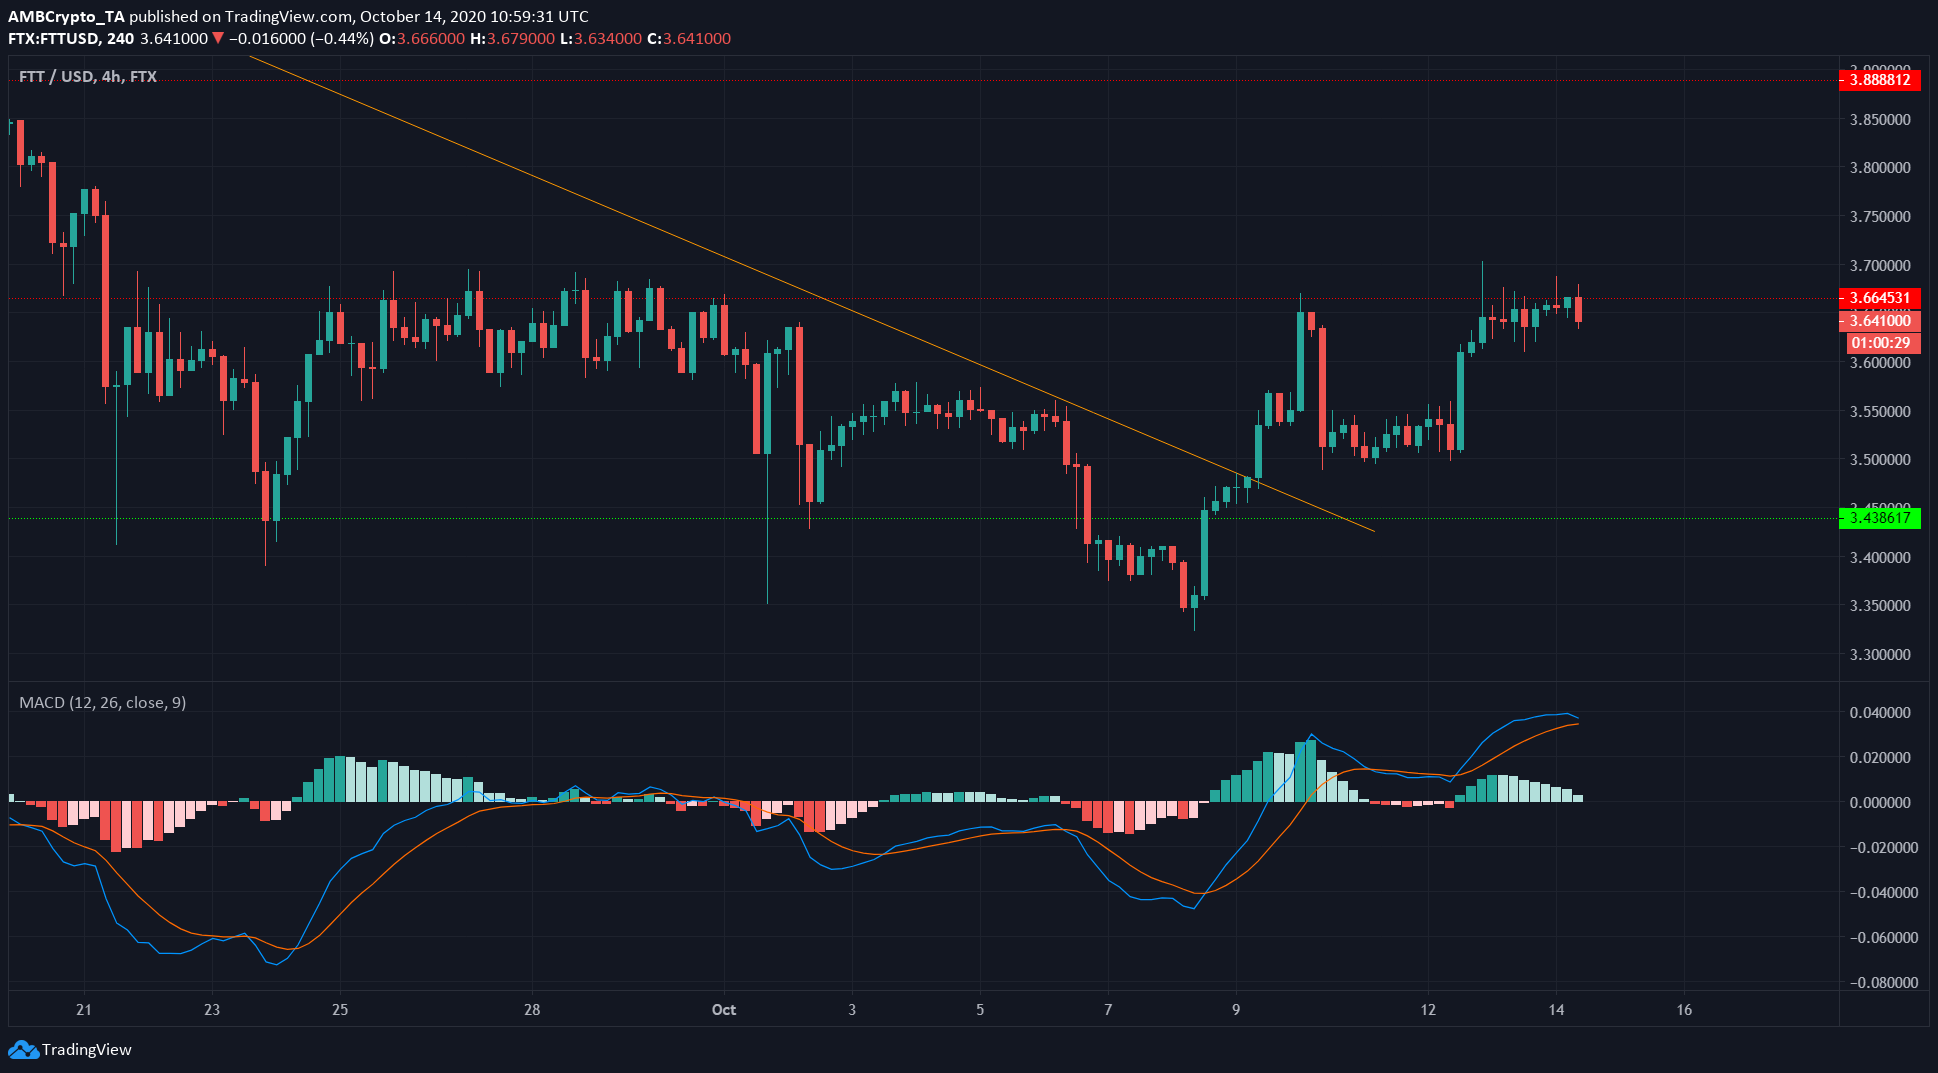
FTT flipped level $3.43 from resistance and surged past the trendline resistance (orange) to touch $3.66 twice in the past few days. At press time the price appeared to be rejected.
However, the MACD had not formed a bearish crossover yet. and both the MACD line and signal line were above the zero line.
A rejection at resistance for FTT could form a higher low for the asset at $3.56 as FTT could expect to find support in that region in the short-term.


