Analysis
XRP slumps by 18% with breach of ascending channel
XRP’s price has been noting an upward climb in the market, after its fall in September. However, Bitcoin’s fall of over 7% in the market was followed by XRP losing 14% of its market value. The coin that was valued at $0.2897 fell to $0.2471. However, it recovered at press time to be valued at $0.2757.
However, the present market trend in the long-term indicates a bearish market that is driving the price of XRP down.
Daily chart

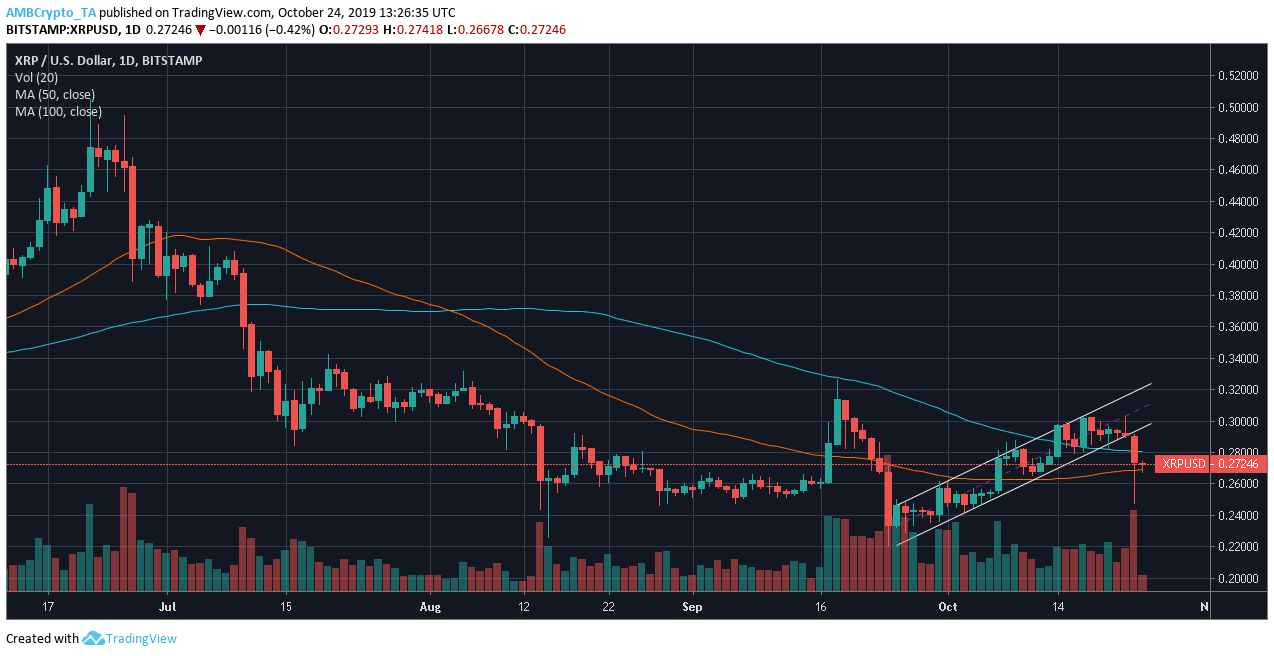
Source: XRP/USD on TradingView
XRP’s daily chart suggested that the coin had breached out of the descending channel pattern, causing its price to slip by 18%. XRP’s higher highs were marked at $0.2470, $0.2777, $0.2994 and lower lows were at $0.2355, $0.2521, and $0.2867. The fall can be reflected in the volume of the coin.
The 50 moving average was under the 100 moving average, noting a bearish market. However, the alignment of averages above the candlesticks indicated an extremely bearish trend.

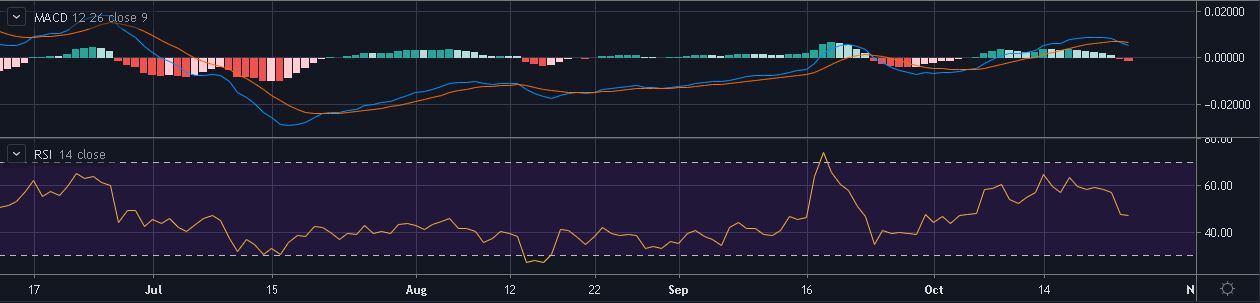
Source: XRP/USD on TradingView
MACD indicator recently underwent a crossover with the signal line pointing at a bearish market. The bearish momentum was picking pace at press time, while the Relative strength Index denoted that the buying and the selling pressure of XRP had attained equilibrium.
Conclusion
XRP’s price noted another fall with a breach of the descending channel. The indicators predicted an extremely bearish market, which the buyers can benefit from.


