Analysis
XRP short-term Price Analysis: 11 August

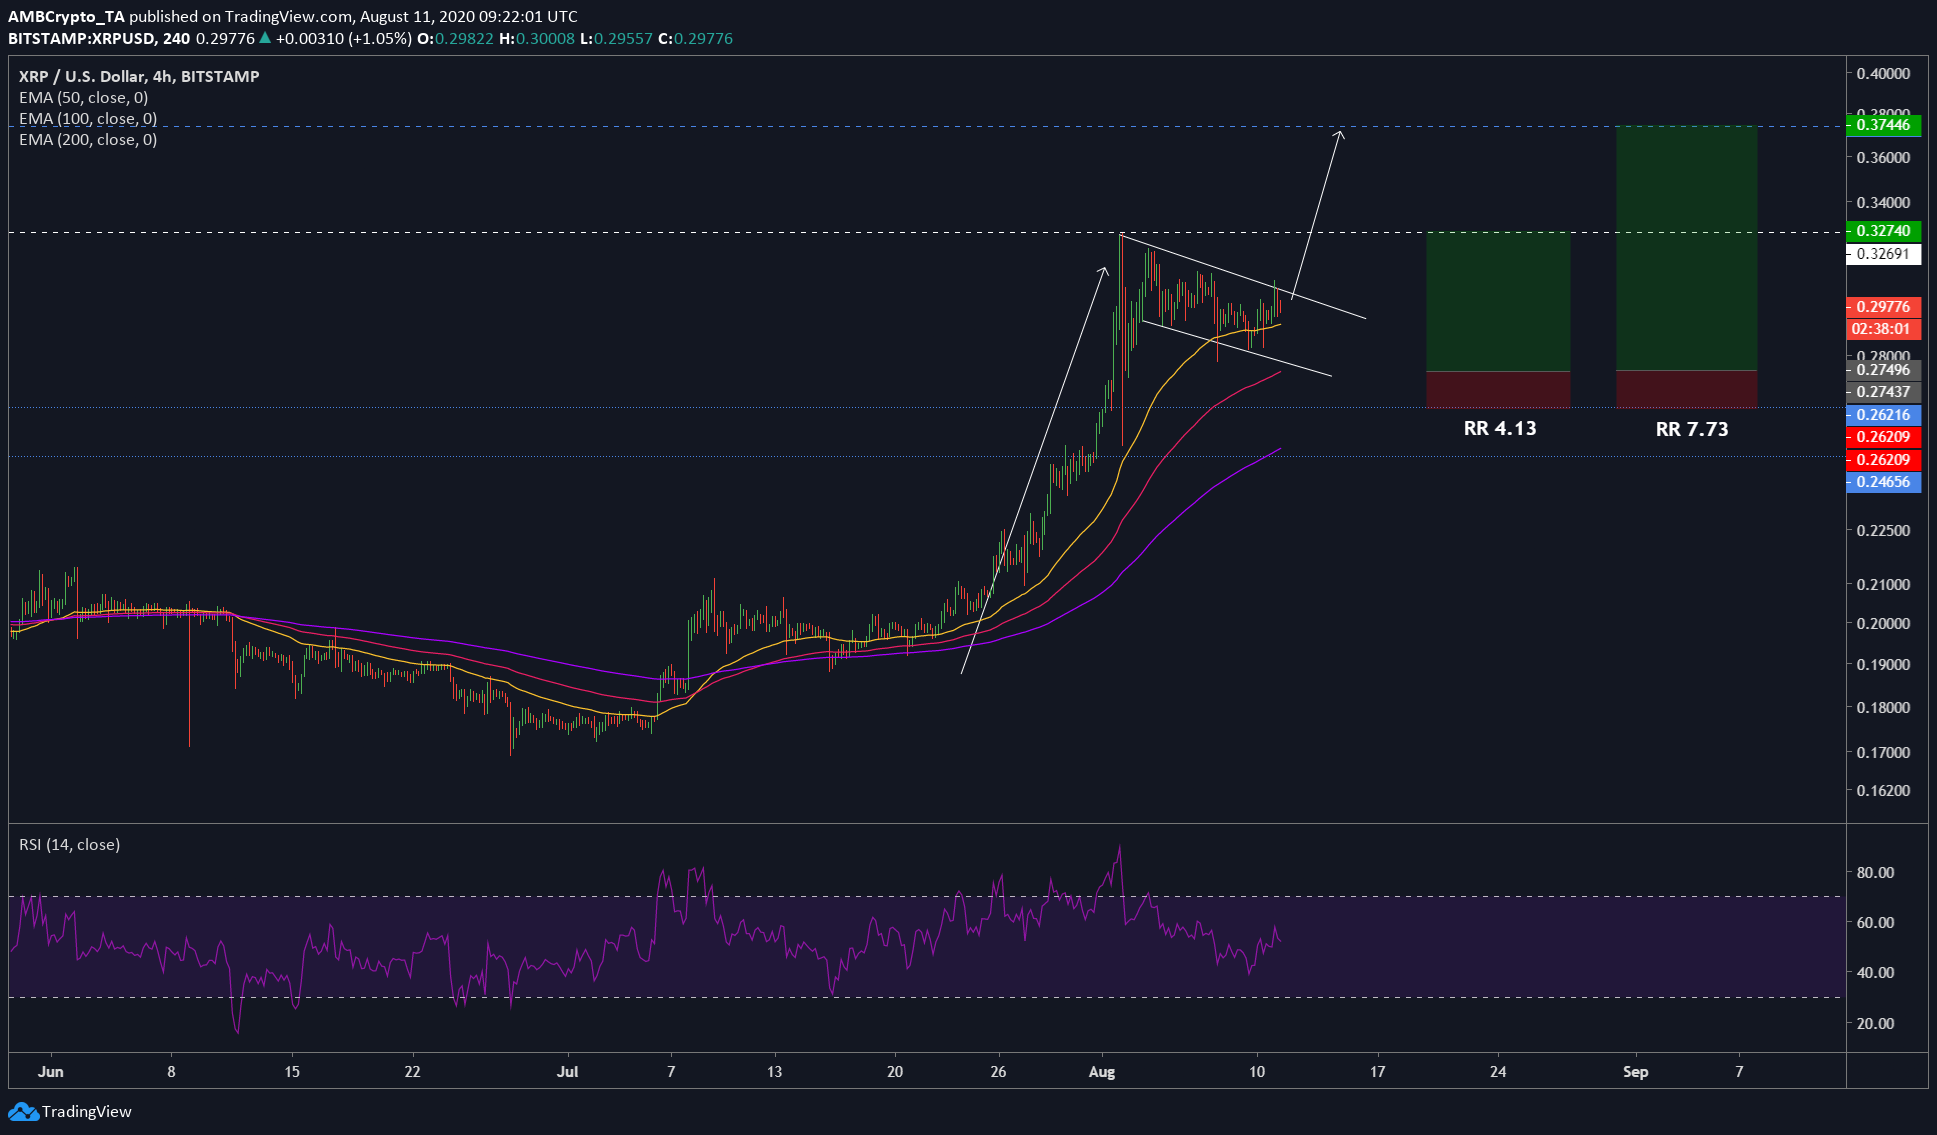
With a market cap of $13.37 billion, XRP is the third-largest cryptocurrency in the world. In the last 2 hours, the coin has seen a minuscule surge of 0.5% but that won’t be the end of it. Due to the formation of a bull flag, the coin shows a potential for a surge ranging from 19-36%.
XRP 4-hour chart

Source: XRPUSD TradingView
The four-hour chart showed the clear ingredients required for the formation of a bull flag. The pole that shows the initial surge, following this is the flag that shows the consolidation of the price; buyers taking a breather of sorts, preparing before taking off on another bullish surge after the breakout.
The consolidation is almost finished, perhaps, a drop to 50 MA [yellow] or even to the 100 MA [pink] would be a good place for a long position. This option would allow for a surge of 19% which would put XRP at $0.327, which is the first target. If the buyers are not exhausted, then a push up to $0.374 can be expected and this would be a 36%.
The second option, a more conservative approach to long would be after the price breaches the flag to the upside and retests it. Alternatively, this would provide an 8% to 24% upside, ie., the same targets but with an entry position at $0.3016.
XRP: A lookback
Source: XRPUSD TradingView
The daily chart shows both good and bad news. The good is that the 50 DMA [yellow] has risen above the 200 DMA [purple], this is a golden crossover and is wildly bullish. The bad news is that the RSI has already hit the overbought zone and is heading back, this means the buyers’ momentum is vanishing, providing an opportunity for the sellers to take control.
This could probably lead to a small retracement, however, the important thing is that XRP’s year-to-date performance now stands at 57%.

