XRP, Monero, Dogecoin Price Analysis: 27 November

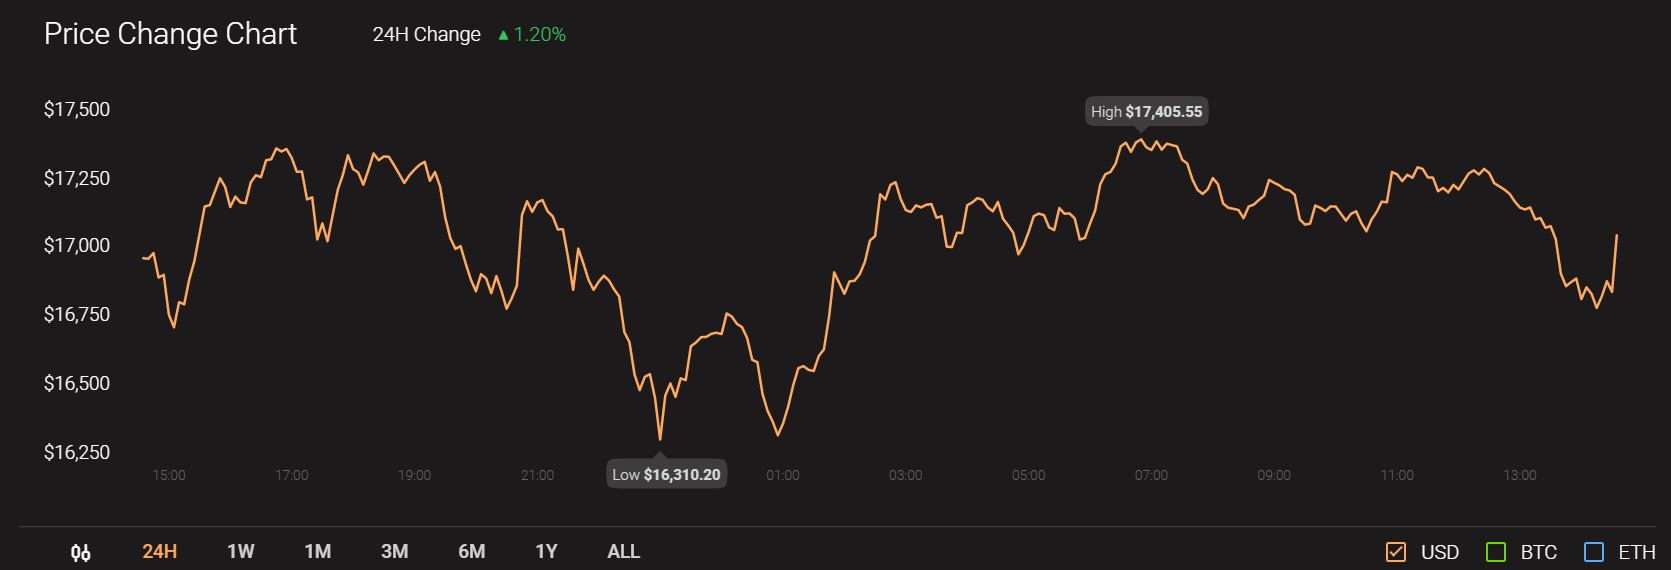
With a drop in Bitcoin’s price in the past 48-hours, most of the market’s altcoins have been facing strong corrections. At press time Bitcoin was being traded at $17,058, with a trading volume of $33 billion.

Source: CoinStats
For popular altcoins like XRP, Monero, Dogecoin this bearish pressure in BTC’s movement has resulted in major price corrections in less than 48-hours’ time.
XRP

Source: XRP/USD, TradingView
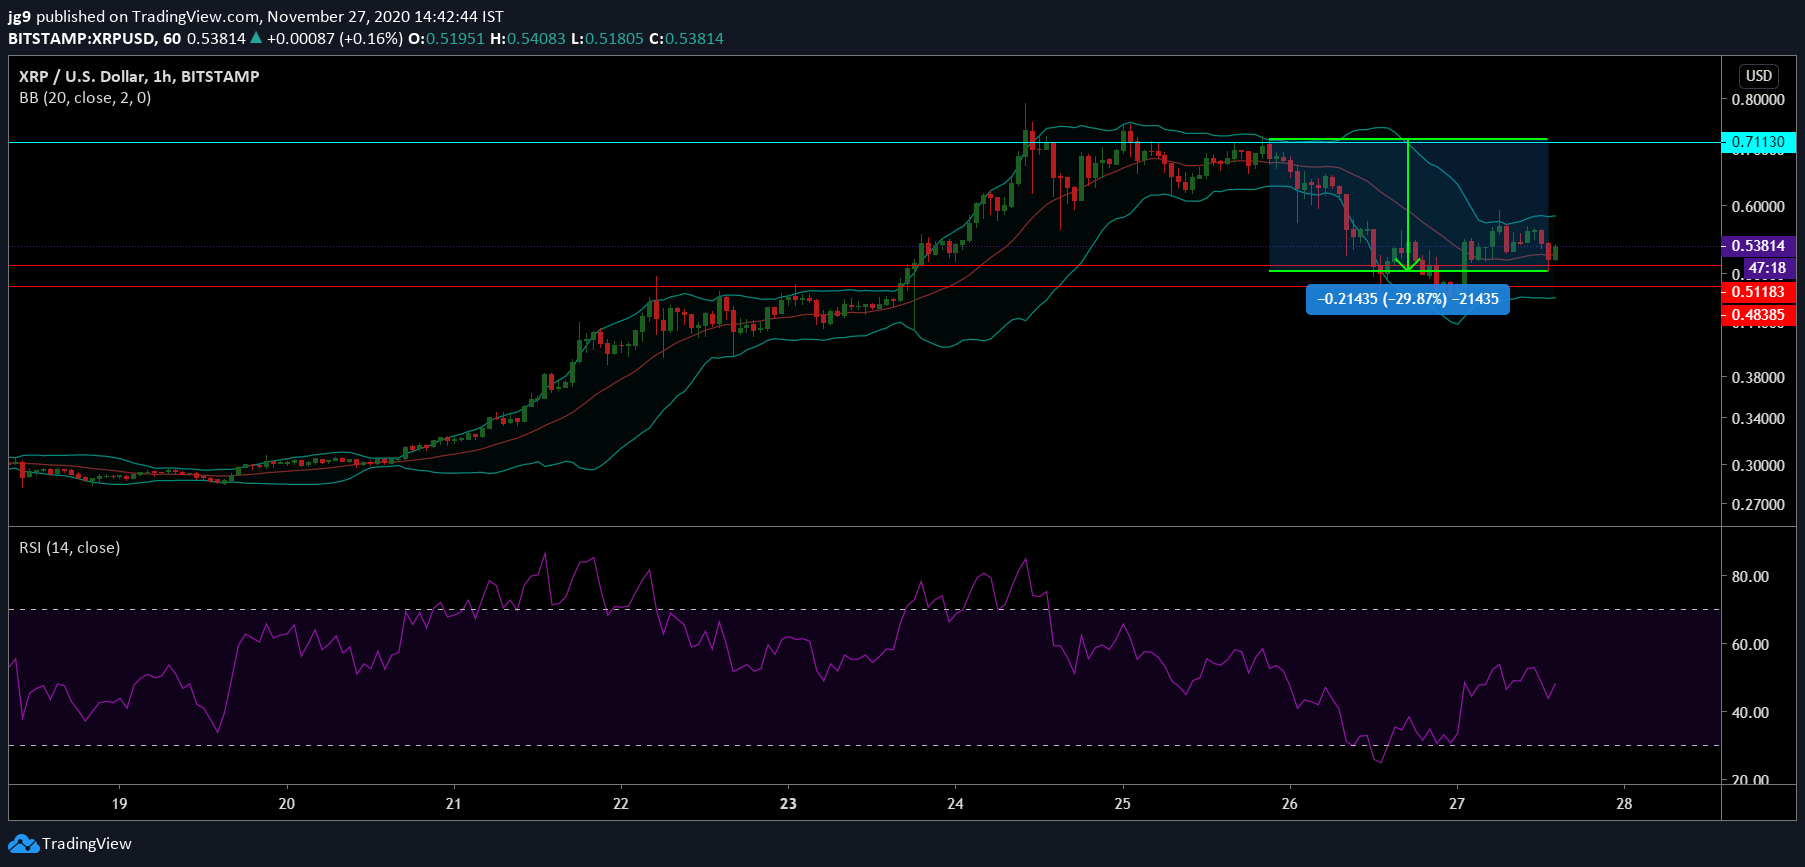
XRP’s price was on a steady rise during the past few weeks. However as the sentiment in the Bitcoin market changed and the price dipped, XRP as always wasn’t immune to the fall. In less than 48-hours the coin’s price has fallen by close to 30 percent and is currently being traded at $0.521. At present, XRP’s trading price is testing the support at $0.51, with another strong support at $0.48.
The Bollinger Bands are not wide and indicate the lack of volatility for XRP’s price action. The RSI also paints a bearish picture as it now heads steadily into the oversold zone.
Monero [XMR]

Source: XMR/USD, TradingView
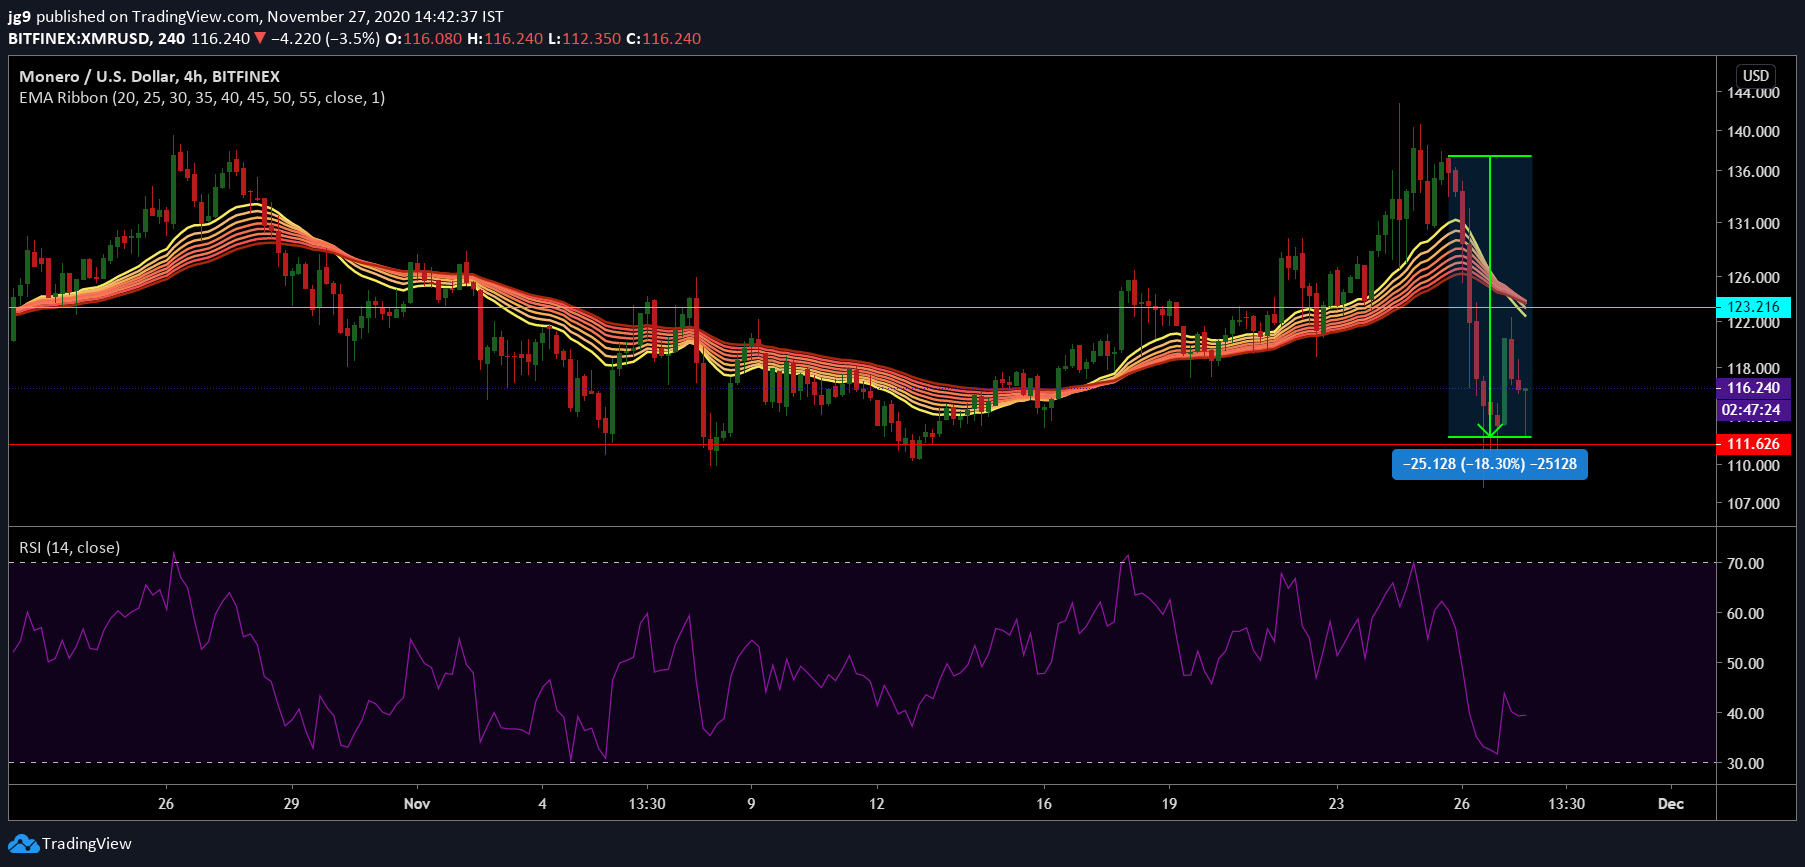
Monero also faced substantial corrections on the price charts as it’s trading price dropped by over 18 percent in the past two days and is currently trading at $113.7. The privacy coin is currently ranked 17th on CoinMarketCap’s list with a market capitalization of over $2 billion. If the price were to further fall it would meet the support at $111. At press time there seems to be significant resistance around the $123 price level.
The EMA ribbons have now settled above the price of Monero and are likely to offer resistance around its key resistance level. The RSI is now very close to the oversold zone after having spent around the neutral level.
Dogecoin [DOGE]

Source: DOGE/USD, TradingView
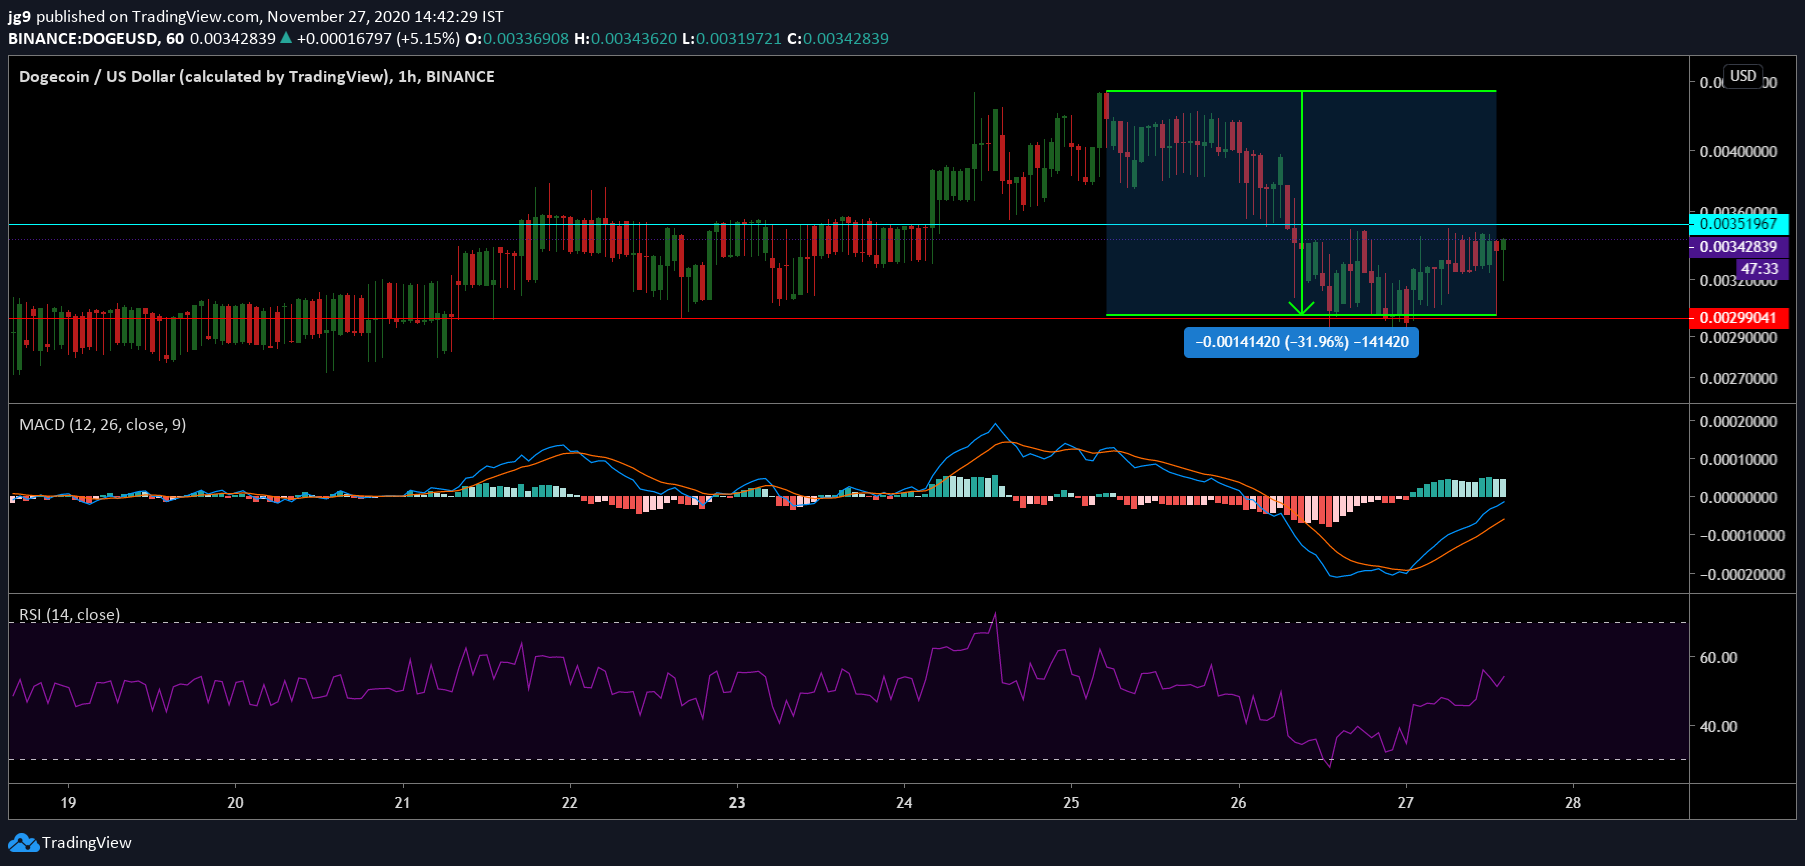
Crypto’s popular meme coin, Dogecoin had a similar fate as its price fell by over 31 percent. At press time the coins is being traded at $0.0032 with strong resistance around the $0.0035 price range. If the price were to continue exhibiting bearish pressure, Dogecoin may soon have to rely on the support at $0.0029 to stabilize its price.
The MACD indicator for Dogecoin has undergone a bearish crossover, while the RSI indicator shows a bit of divergence as it remains in the neutral zone but seems to be heading towards the overbought zone.


