Analysis
XRP might finally rise back up to $0.34

Between June 22 and July 15, XRP dropped by almost 44%, from $0.50 to $0.283. Since then, the coin has been unable to rise above the $0.34 mark, though that may be about to change in the coming months. At the time of writing, XRP was valued at around $0.21, with a market capitalization of over $9.2 billion.
XRP 1-day chart

Source: XRPUSD on TradingView
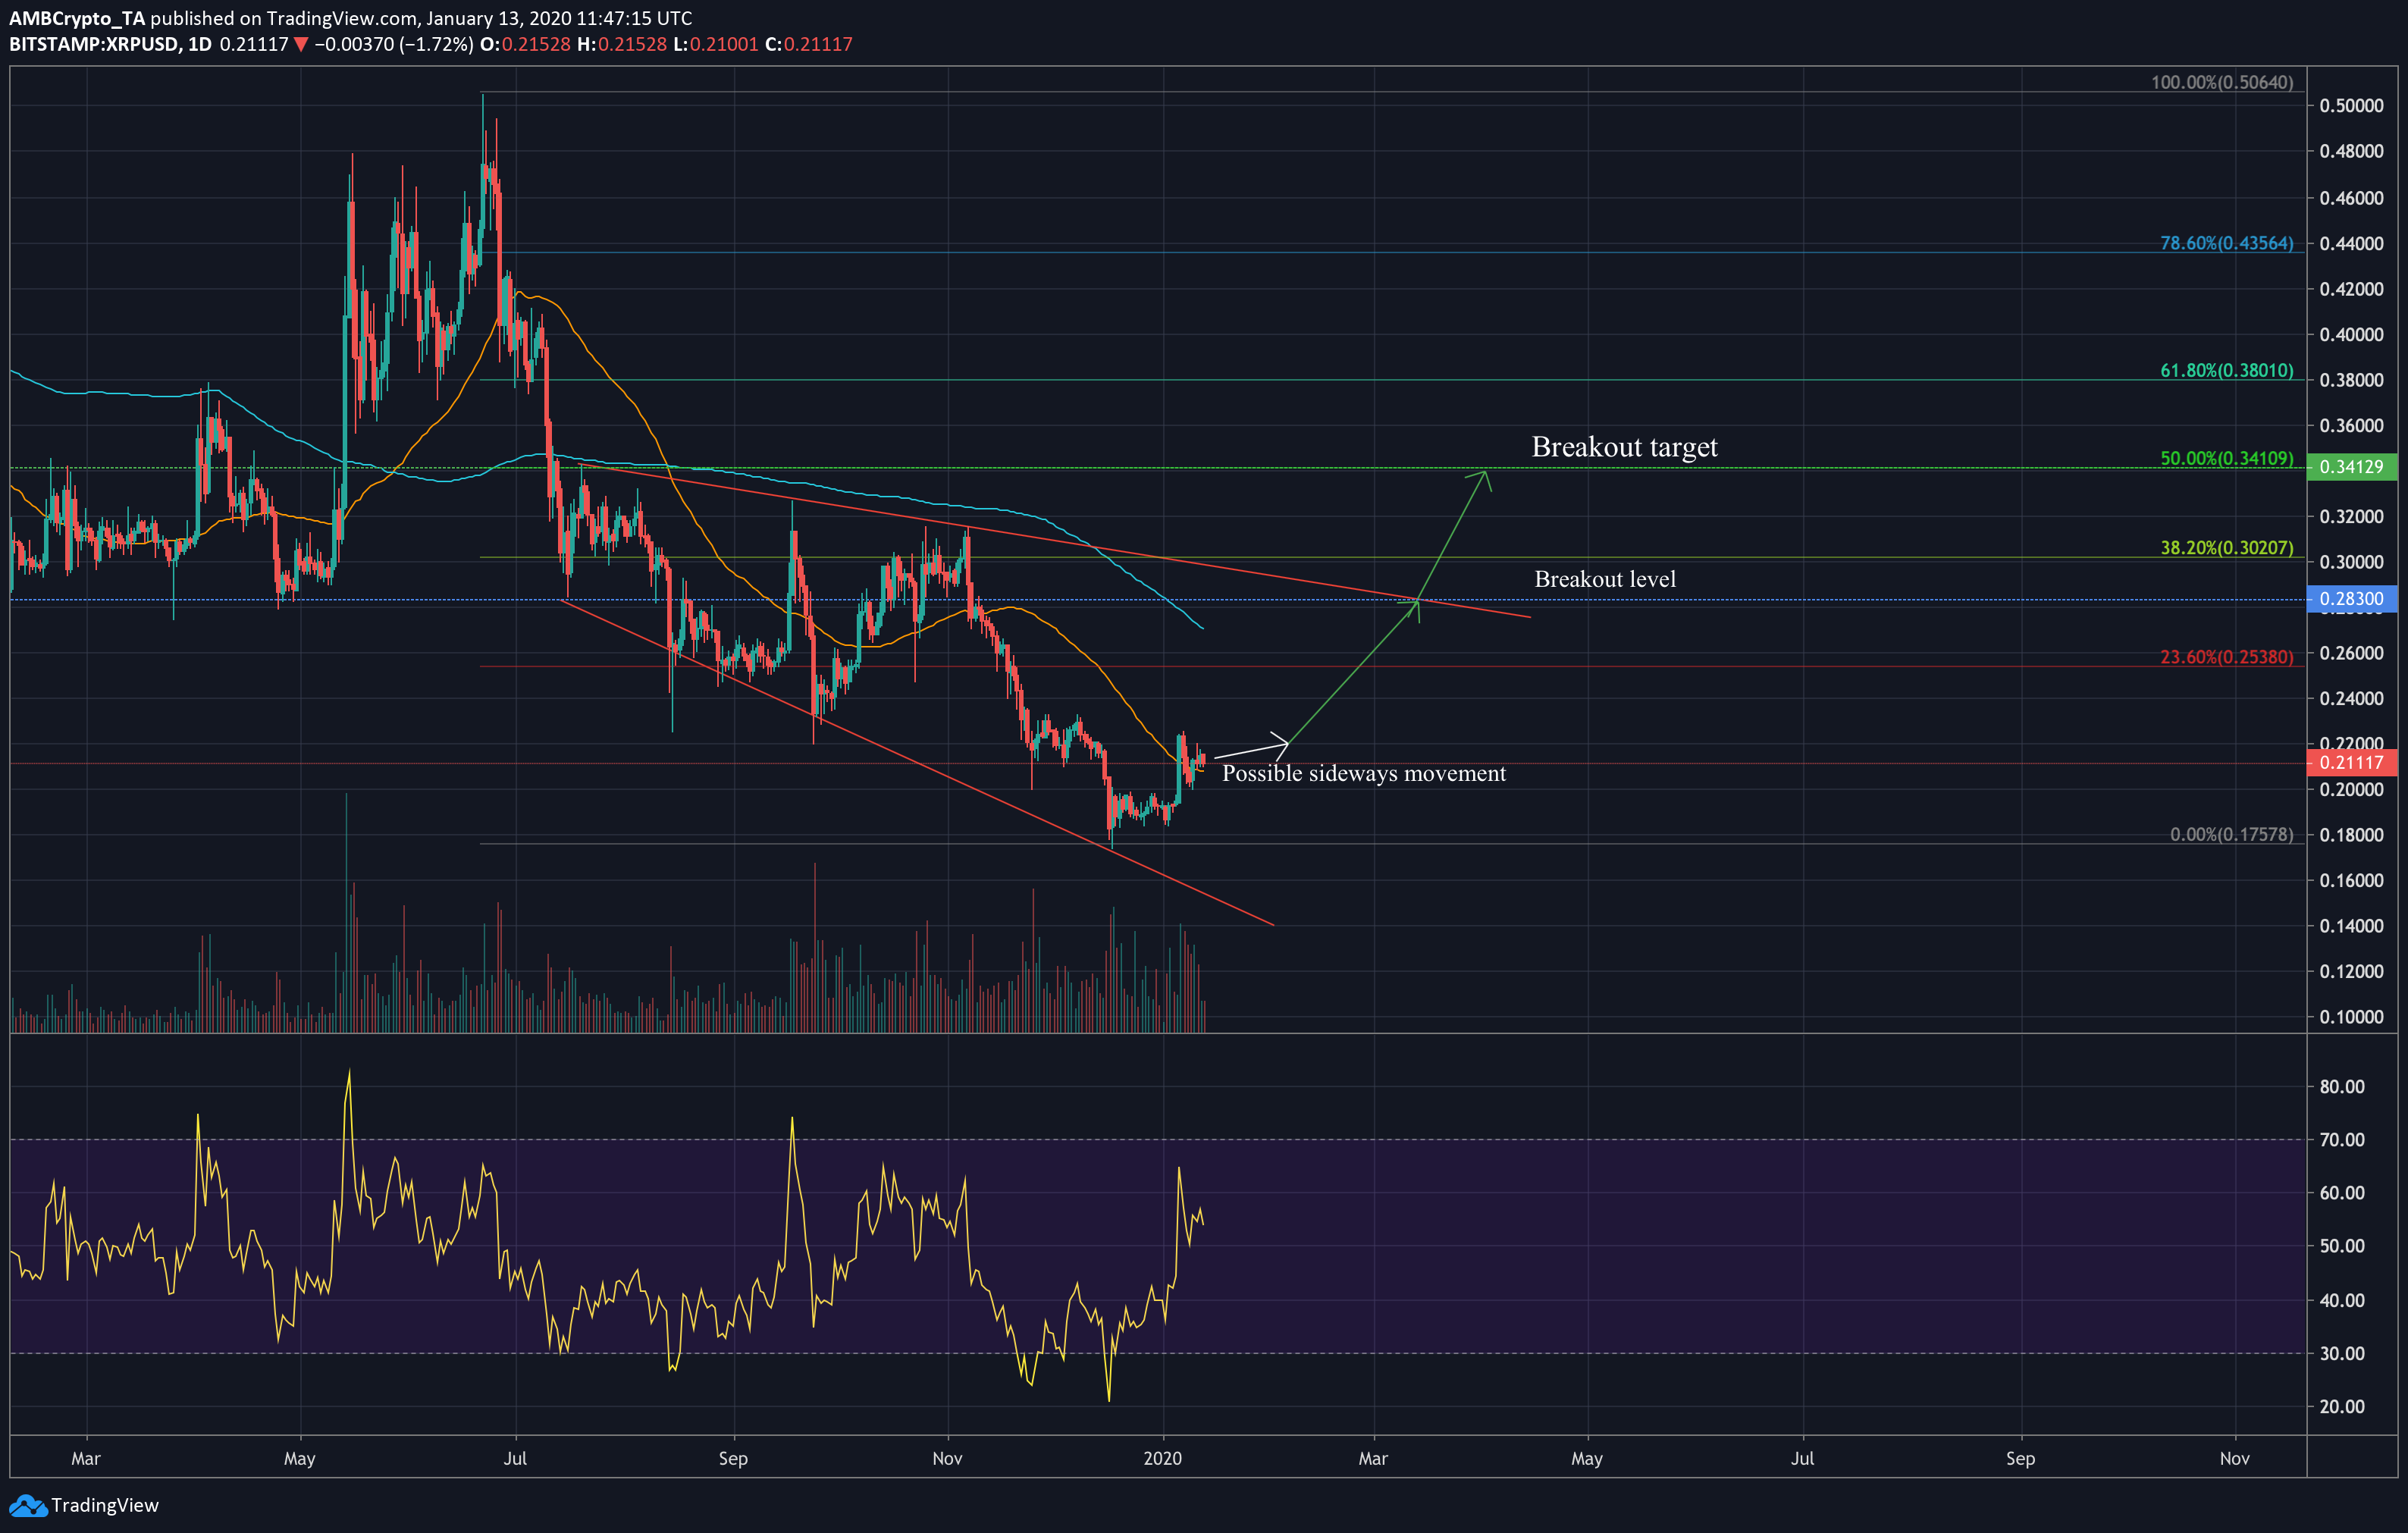
The 1-day chart shows XRP in a descending broadening wedge pattern since mid-July, accompanied by a rising trend in volume, as tends to be the case with this formation. In 58% of cases, descending broadening wedges act as reversal patterns, reversing the prevailing trend through which the price entered the pattern. In this case, XRP could be in for an upward-facing breakout.
The 50-day moving average was seen just under the price line, with XRP having crossed above it just a week back. This could be a sign of some bullish movement in the near future. With the 200-day moving average trudging along far above the price line, this looks like an overall bearish scenario. However, as the 200-DMA looks to be dipping downward, this could be a great opportunity for the coin to flip the market into a more bullish situation. The death cross which took place in mid-August last year was still in play at the time of writing.
XRP is likely to face resistance from the 23.6% Fibonacci retracement line on its journey upward, before facing off against the upper pattern trend line at $0.283. The On-Balance Volume (OBV) indicator has been on the rise since December, indicating higher buy-volume than sell-volume over the last few weeks, and this could be exactly the bullish momentum XRP needs to push back to earlier levels over the coming weeks.
XRP Volatility
Source: CoinMetrics
Data from CoinMetrics showed XRP’s 30-day volatility at its highest level since late-October; this has been rising since the start of mid-December. This could aid XRP in making some large swings up in price, however, volatility is a double-edged sword, and could cause some catastrophic drops instead. The recent increase in volatility has been in short bursts, followed by periods of consistent volatility, which could mean XRP will continue at this level of volatility for the next week or so.
Conclusion
As descending broadening wedges have a slight bias toward upward breakouts, the bullish signs from indicators seem believable in this scenario. There could be some sideways movement in the next few days, which will likely be followed by a rise to $0.283 in March. From this breakout point, XRP might get a boost to $0.34 before May begins. As the OBV continues to rise and buy-volumes increase, XRP could be in for a bullish market.

