XRP, Maker, Ontology Price Analysis: 23 October

As the crypto market displayed strong buying sentiment, the bullish trend added to the valuations of most altcoins for a third consecutive day. Maker gained almost 3.5 % in its valuation since yesterday, signaling bullishness in the short-term period. XRP too sided with the bulls noting some gains on its trading charts.
While for Ontology the effect of the crypto market surge was quite the opposite. At the time of writing, the ONT market displayed a minor price correction losing close to percent, with a hint of approaching bearishness.
XRP

Source: XRP/USD on TradingView
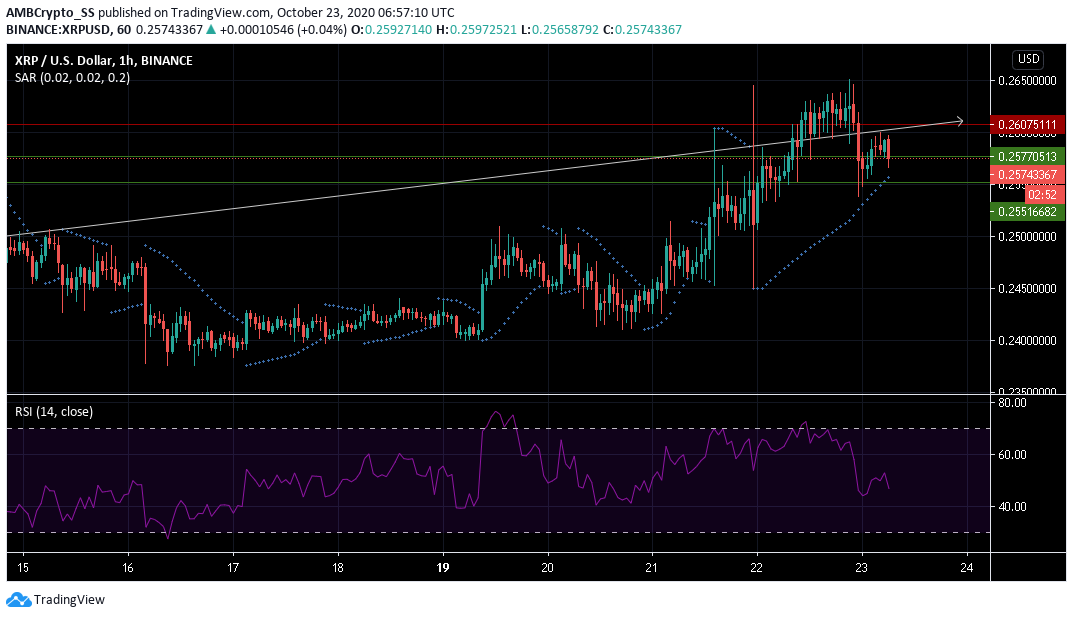
At the time of writing, XRP was seen rising above the $0.255 level of support and further climbed up to the $0.257 level. The digital asset gained a percent since yesterday.
The Relative Strength Index was depicting a change towards a selling sentiment, as it quickly plunged below the neutral zone.
However, this also coincided with the recent price dive to the support level, and given the market bullishness, a pullback from this level is expected over the upcoming trading sessions. In fact, the Parabolic SAR also signaled an upward price trend as the dotted lines lay below the candles.
A gradual uptick towards the $ 0.260 resistance level remains a likely scenario in the short-term period.
Maker [MKR]

Source: MKR/USD on TradingView
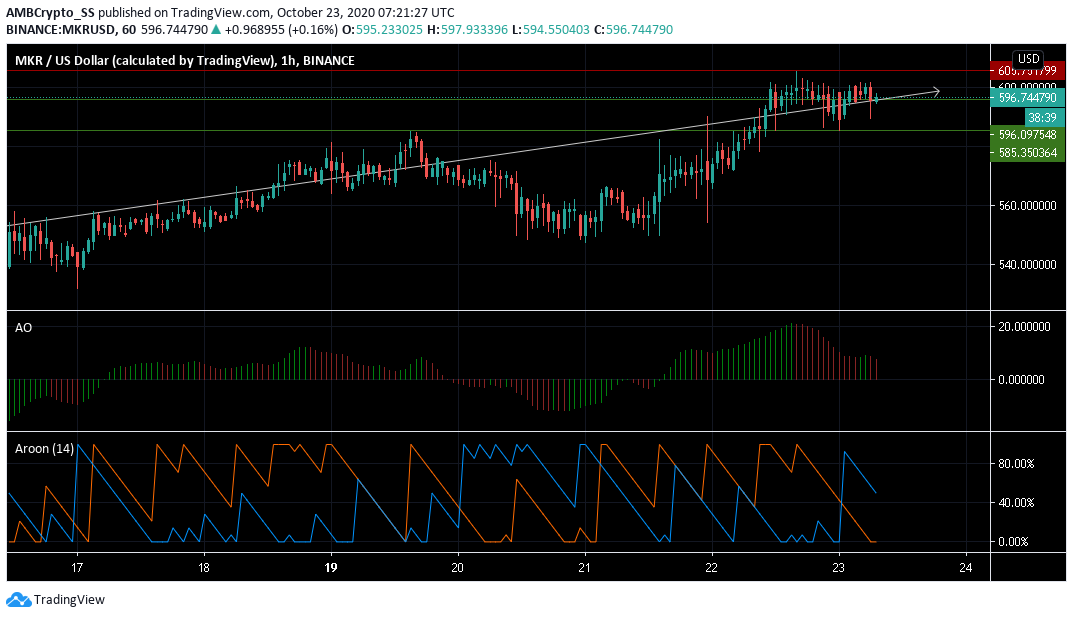
The Maker market witnessed appreciable gains of over 10% in the past one week. MKR was being traded at $596.74 at press time.
The upsurge also witnessed minor dips as the bullish phase seemed to have calmed down along the $596.09 level of support.
Awesome Oscillator with its red closing bars above the zero line also suggested the same, underlining a hint of selling pressure. Aroon indicator made a bearish crossover, with Aroon Down (blue) rising above the Aroon Up (orange).
The sentiment however is likely to reverse soon, as prices could be seen moving back up after taking support at the $585. 35 level.
Ontology [ONT]

Source: ONT/USD on TradingView
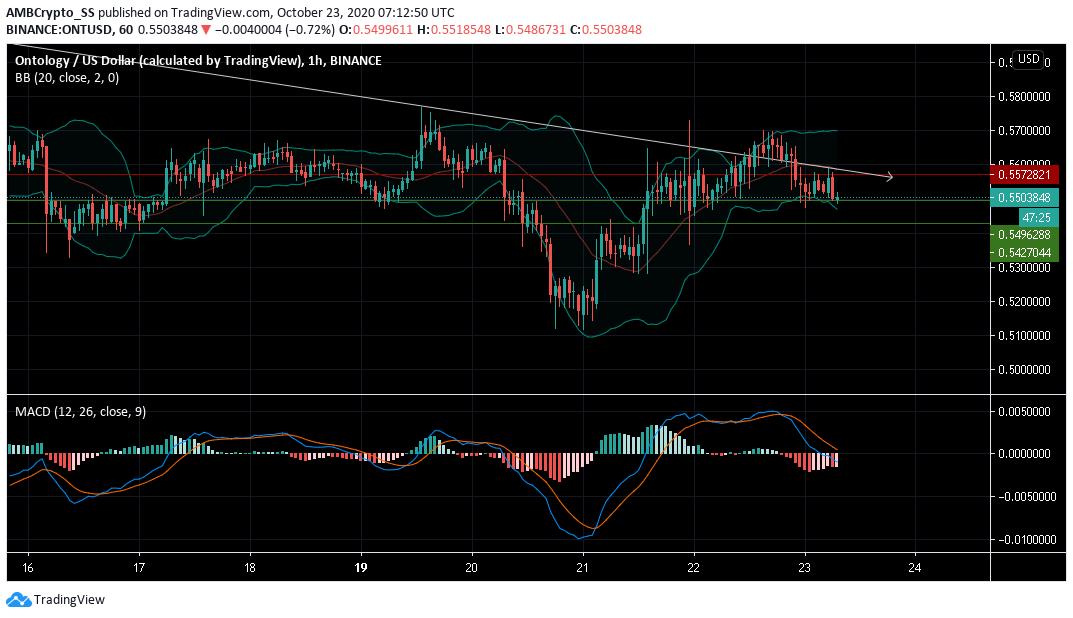
Recording losses at press time, Ontology, in opposition to a market-wide bullish trend witnessed some bearish activity, on its trading charts.
Bollinger bands were displaying an increase in the volatility levels, suggesting possibilities of further bearish swings. Prices were also seen moving downwards along the lower bands.
Further, the MACD indicator, sided with the bears, displaying a bearish crossover, as the MACD line dived under the signal line.
With the current scenario, a fall towards the next support at $0.542 seems possible over the next few trading sessions.


