Altcoins
XRP in for short-term downward breakout; LTC and LINK follow suit

Altcoins XRP, Litecoin, and LINK that trended downward post the March 12 market crash recorded an increase in price with the start of April. However, all three coins are expecting a short-term downward breakout in the near future.
Litecoin

Source: LTC/USD, TradingView
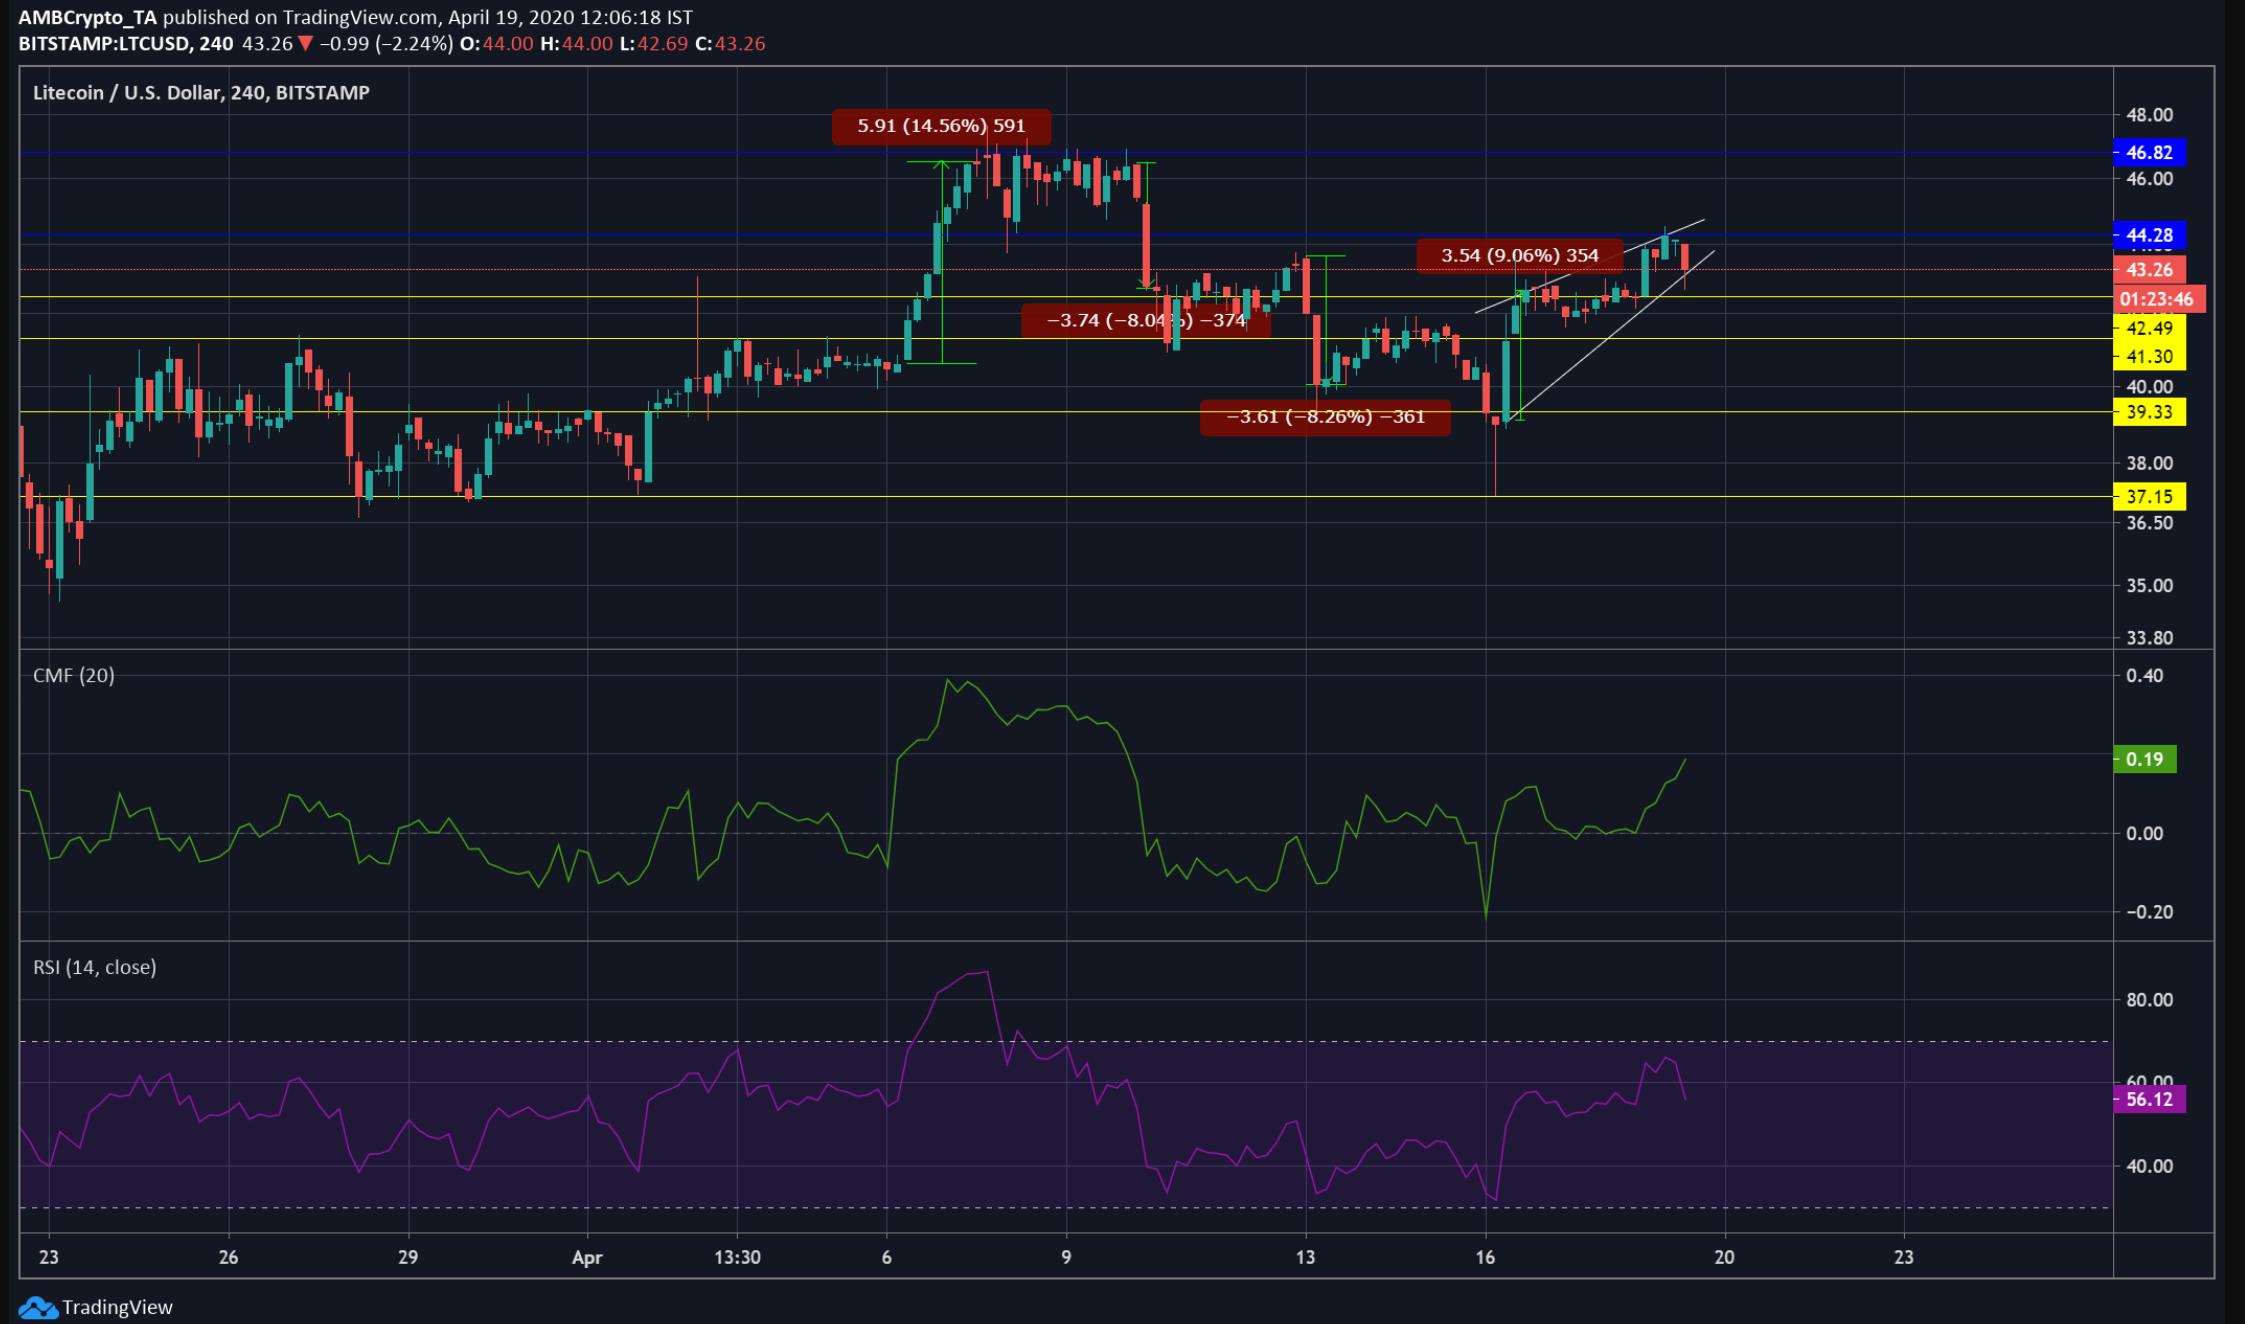
The top 7th coin which had maintained constant support at $39.33 post the market crash on March 12, saw a sudden spike in the price by 14.56% with the price reaching $46.49 in the first week of April. This, however, was soon followed by a bearish run. The price fell by 8% on April 10 and dropped further by 8% reaching $40.08 in just a week. On April 16, there was a slight increase in the coin’s price and maintained support at $42.49 as of press time. As seen in the above chart, there is a formation of a potential rising wedge, which hints at a further downward breakout. RSI indicator also hints at a possible oversold situation. CMF indicator, on the other hand, rests above the zero line says a different story.
Resistance:$44.28, $46.82
Support: $42.49, $41.30, $39.33, $37.15
At press time:
Price: $43.13
Market Cap: $2,817,026,494
24-hour Trading Volume: $4,510,610,431
Source: XRP/USD, TradingView
XRP
After recording a 37% drop on March 12, XRP has been trending upward with minor short-term breakouts as seen in the above chart. Having maintained constant support at $0.16 since March 26, the coin rose up by 14% on April 6 and has maintained support at $0.17. Although the coin is trending upwards at the moment, there might be a short-term downward breakout soon and this is further confirmed by Awesome Oscillator indicator.
Resistance: $0.20, $0.21, $0.24
Support: $0.17, $0.16, $0.14
At press time
Price: $0.19
Market Cap: $8,569,385,508
24-hour Trading Volume: $1,979,526,570
LINK
Source: LINK/USD, TradingView
Link has been trending downwards since the ‘Black Thursday’; the coin was trending as low as $2, However, at the beginning of April the coin’s price saw an increase of 23% reaching $2.8. The coin recorded another increase of 18% over the following week. Having maintained constant support at $2.99 for over 8 days the coin recorded again recorded a rise by 21.5%. However, as seen in the above chart, the formation of a rising wedge pattern signals a further downward breakout and widening Bollinger Bands also indicates high volatility in the coming days.
Resistance: $3.83
Support:$3.43, $3.10, $2.99, $2.72
At press time:
Price: $3.67
Market Cap: $1,301,182,970
24-hour Trading Volume: $550,550,205

![Reasons why Litecoin [LTC] investors should be concerned](https://engamb.b-cdn.net/wp-content/uploads/2023/12/ambcrypto_A_Litecoin-themed_scen-400x240.png)