
With the start of a new quarter, slowly but surely some altcoins are moving out of Bitcoin‘s shadow. As the $9,000 mark does not look to budge for the king coin, some alts, led by the top two Ethereum and XRP are seeing wayward movement, but all of them are looking up.
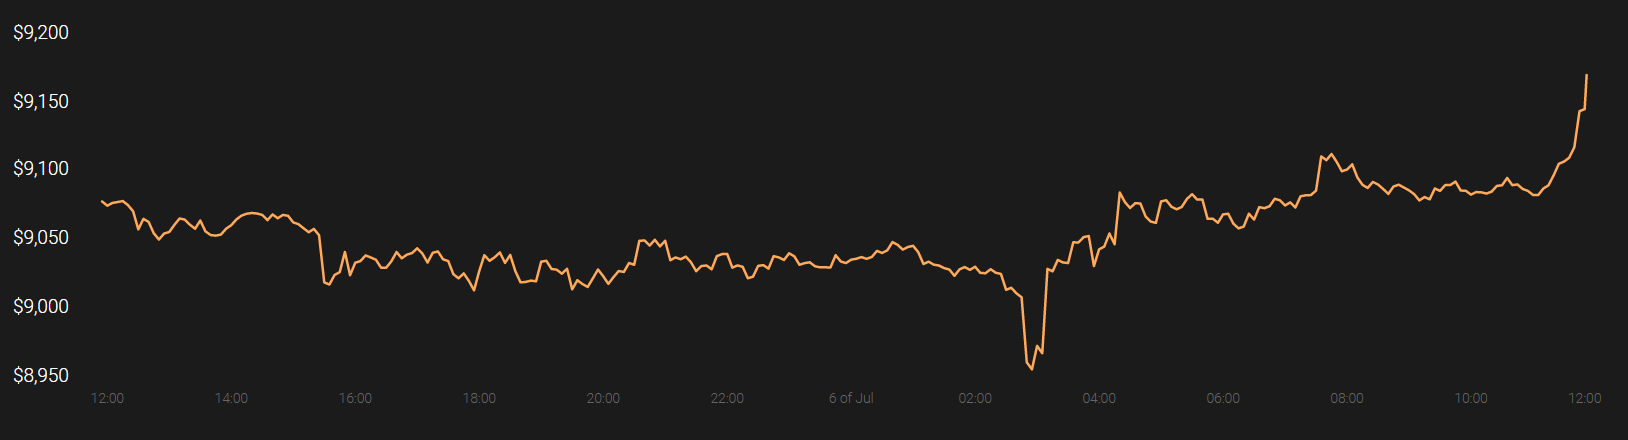
Source: BTCUSD via Coinstats
XRP
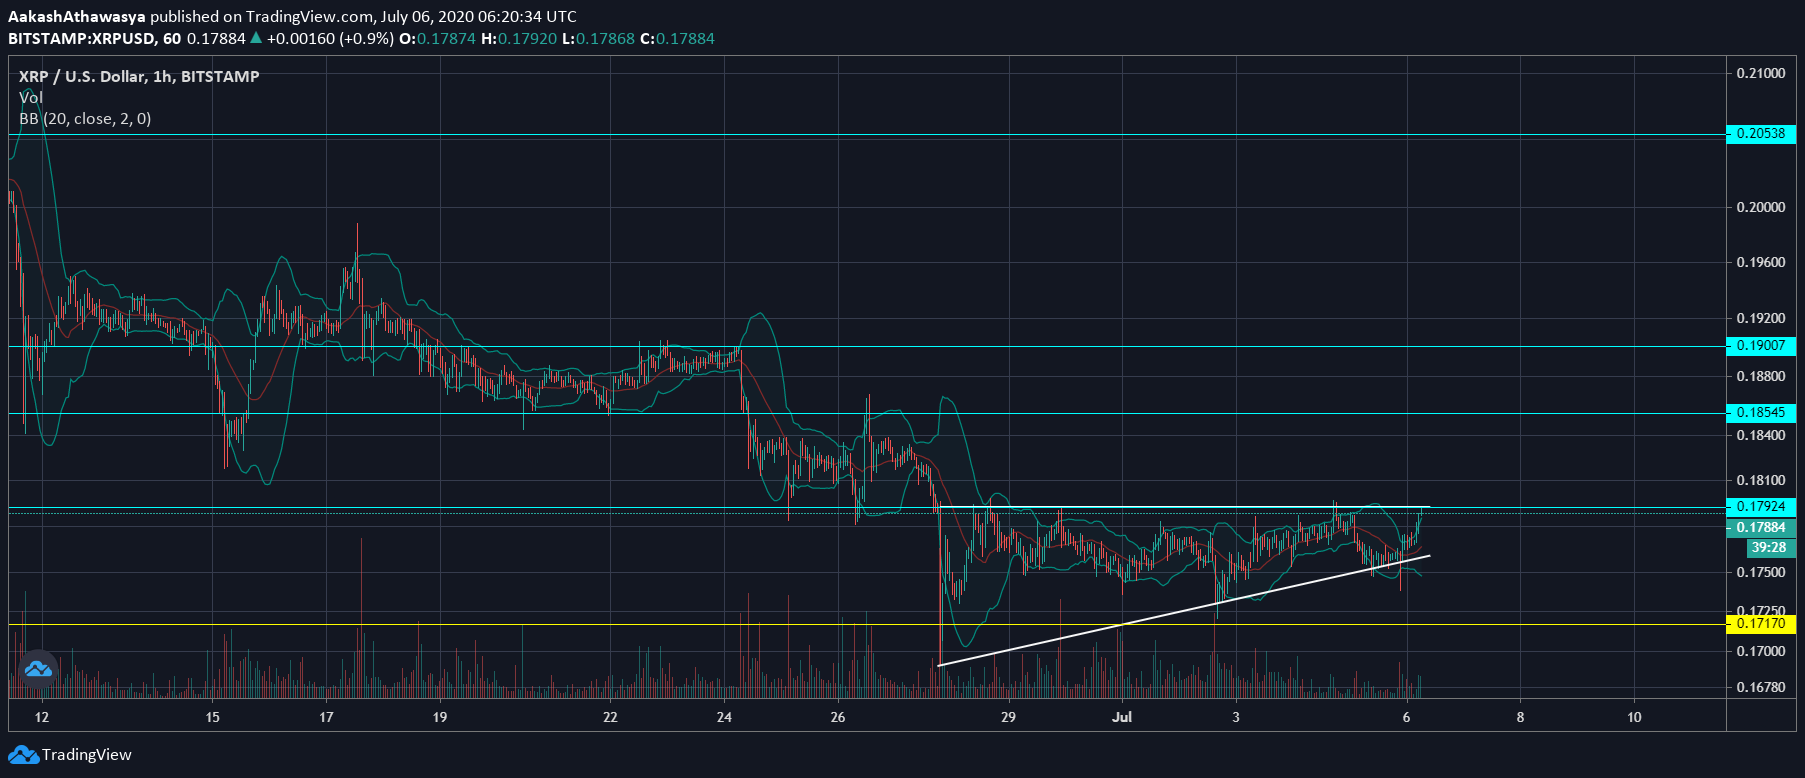
Source: XRPUSD via Trading View
After finishing the quarter much like how it started it, XRP is still trading within the $0.15 to $0.17 range, without much momentum. Since dropping to as low as $0.162 at the end of June, the price has continued to increase but is still stuck in an ascending triangle.
The top of the triangle acts as a resistance at $0.179, which the coin fell below on 28 June. As the price continues to get squeezed with higher lows but unchanged highs, a breakout is on the cards. Bollinger Bands point to a subtle increase, with the simple moving average now below the current trading price of $0.178.
Ethereum Classic
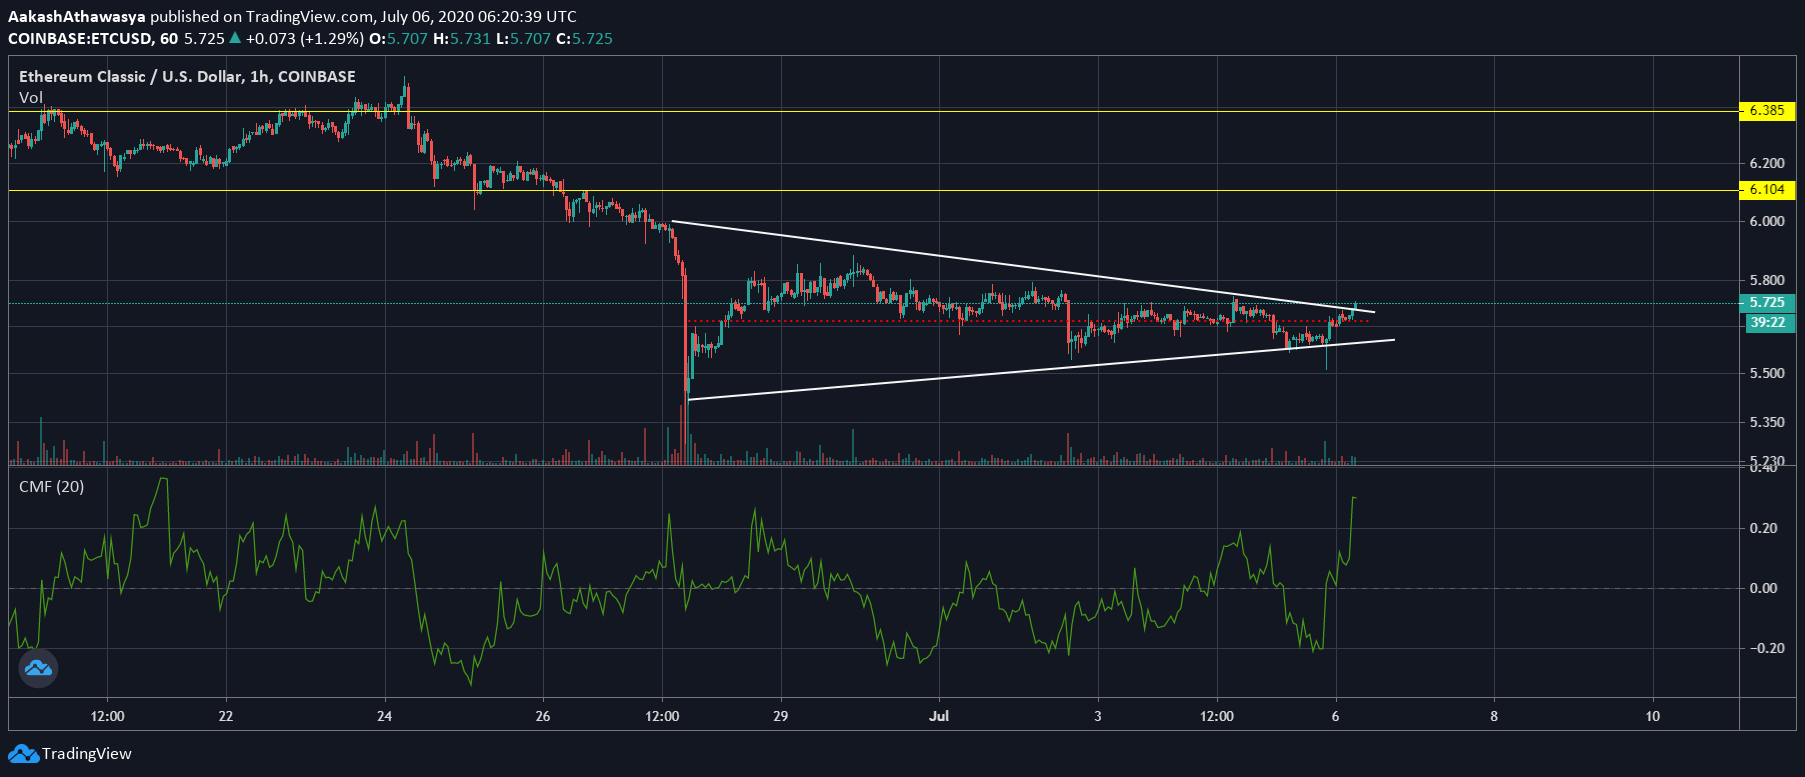
Source: ETCUSD via Trading View
The hardfork of the second-largest cryptocurrency in the market, Ethereum Classic, is also trading with some stability. With a trading price of $5.71 at press time, the altcoin has formed an almost parallel wedge.
Mounted on the 27 June fall from $6.1 to below $5.3, the price has been increasing, but within the wedge. It should be noted that in the early hours of the 6th the price increased past the average of the wedge and closer to the upper ceiling. CMF points to a massive increase in the inflow of funds, reaching its highest point since early June 2020.
Q2 2020 was significant for ETC as it went through its Phoenix hardfork on May 31, which was similar to Ethereum’s Istanbul hardfork.
ChainLink
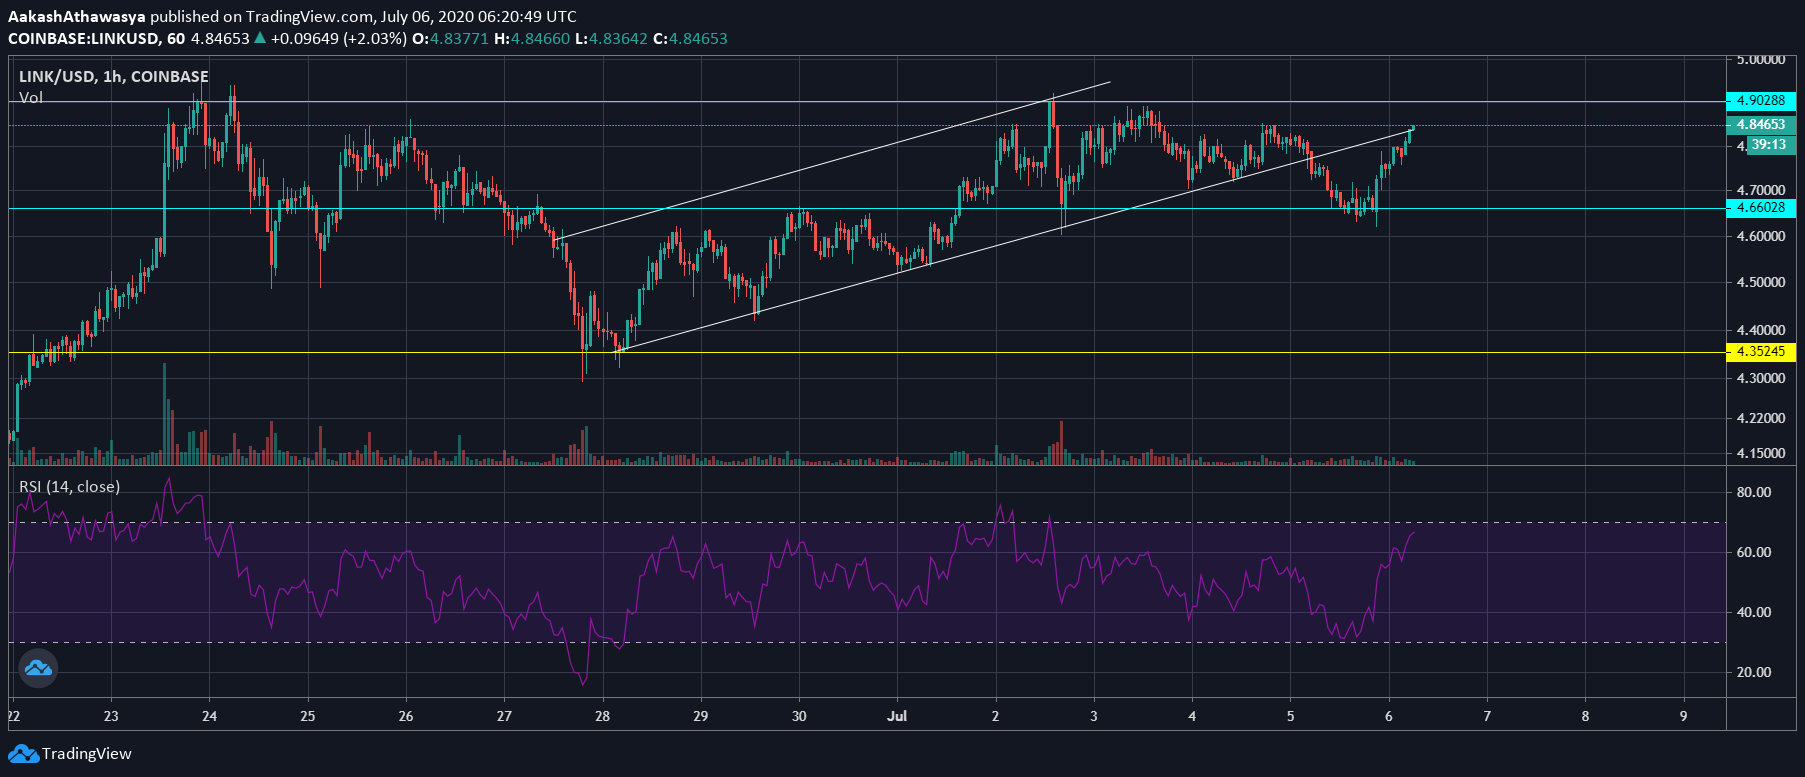
Source: LINKUSD via Trading View
Unlike the rest of the altcoins, Chainlink has been trading with a strong bullish bias in the past few days, resulting in a price increase from support at $4.32 to just below $5.
Now, as LINK trades at $4.84, it is trading with the two resistance levels at $4.66 and $4.9. An upward channel had formed on 27 June, however, the altcoin broke out of it on 5 July, but now as the price is recovering it is estimated to move back into the channel. Relative Strength Index of the altcoin has seen a massive increase in the past 24 hours increasing from 30 to 66.74.
Last week, the cryptocurrency exchange Huobi became the first exchange to run a Chainlink node, and provide exchange data to the cryptocurrency’s users.