XRP, Dash, BAT Price Analysis: 25 November

The bullish sentiment has not yet abated in the altcoin markets as many coins saw a dip in price. The sellers were not yet out in force and XRP and Dash still had the legs for another move upward.
XRP

Source: XRP/USD on TradingView
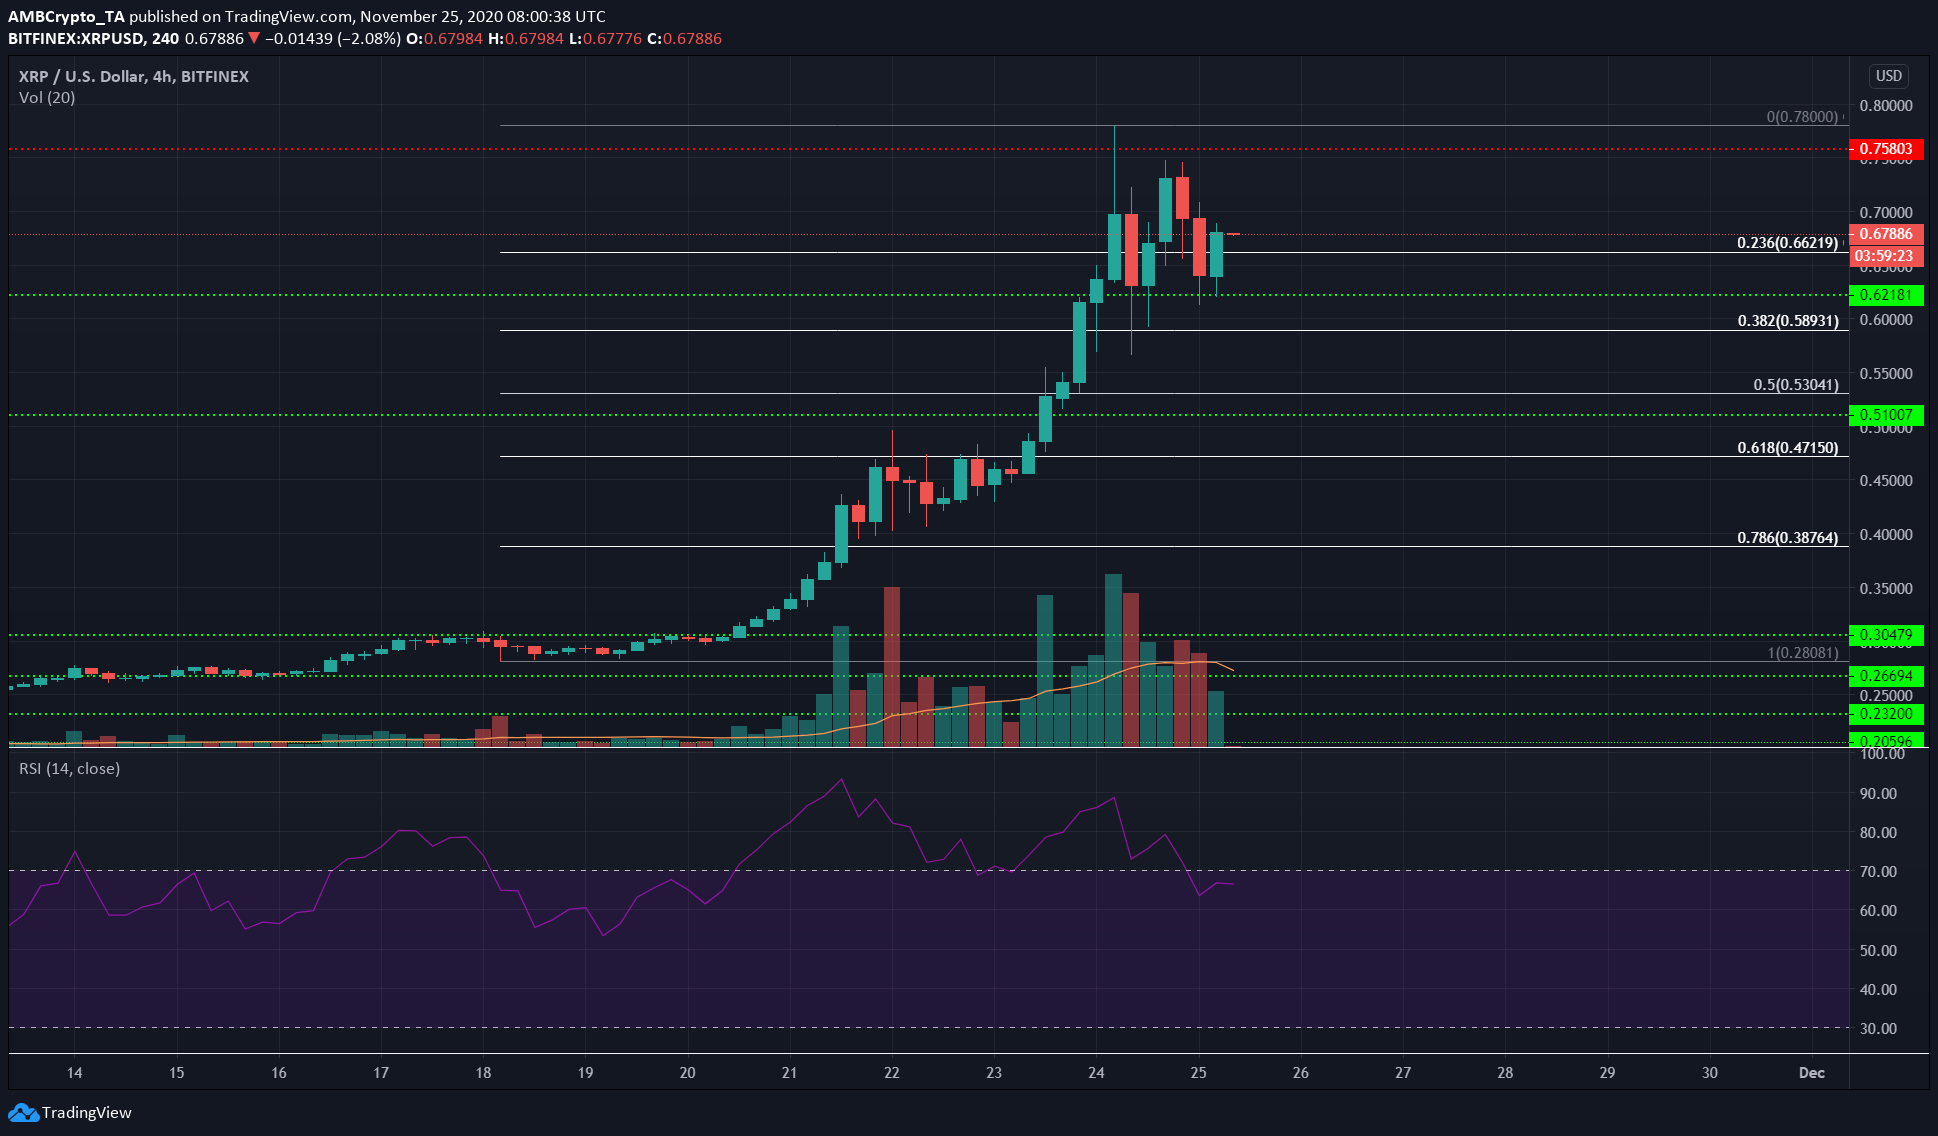
XRP rose to $0.78 before facing selling pressure (although Coinbase saw a spike to $0.92 before crashing in seconds). Using the Fibonacci Retracement tool, some levels where XRP could retrace to are highlighted.
Considering that the asset has more than doubled in value within a week, XRP could retrace up to 60% of the recent gains. Yet it was too early to call the local top for XRP.
The falling trading volume on a pullback suggested that further upside is possible. The price tested support at $0.62 and bounced upward after a bearish divergence on the RSI.
The momentum was still with the bulls and more buyers can be expected to arrive at the XRP market in the coming days.
Dash [DASH]

Source: DASH/USDT on TradingView
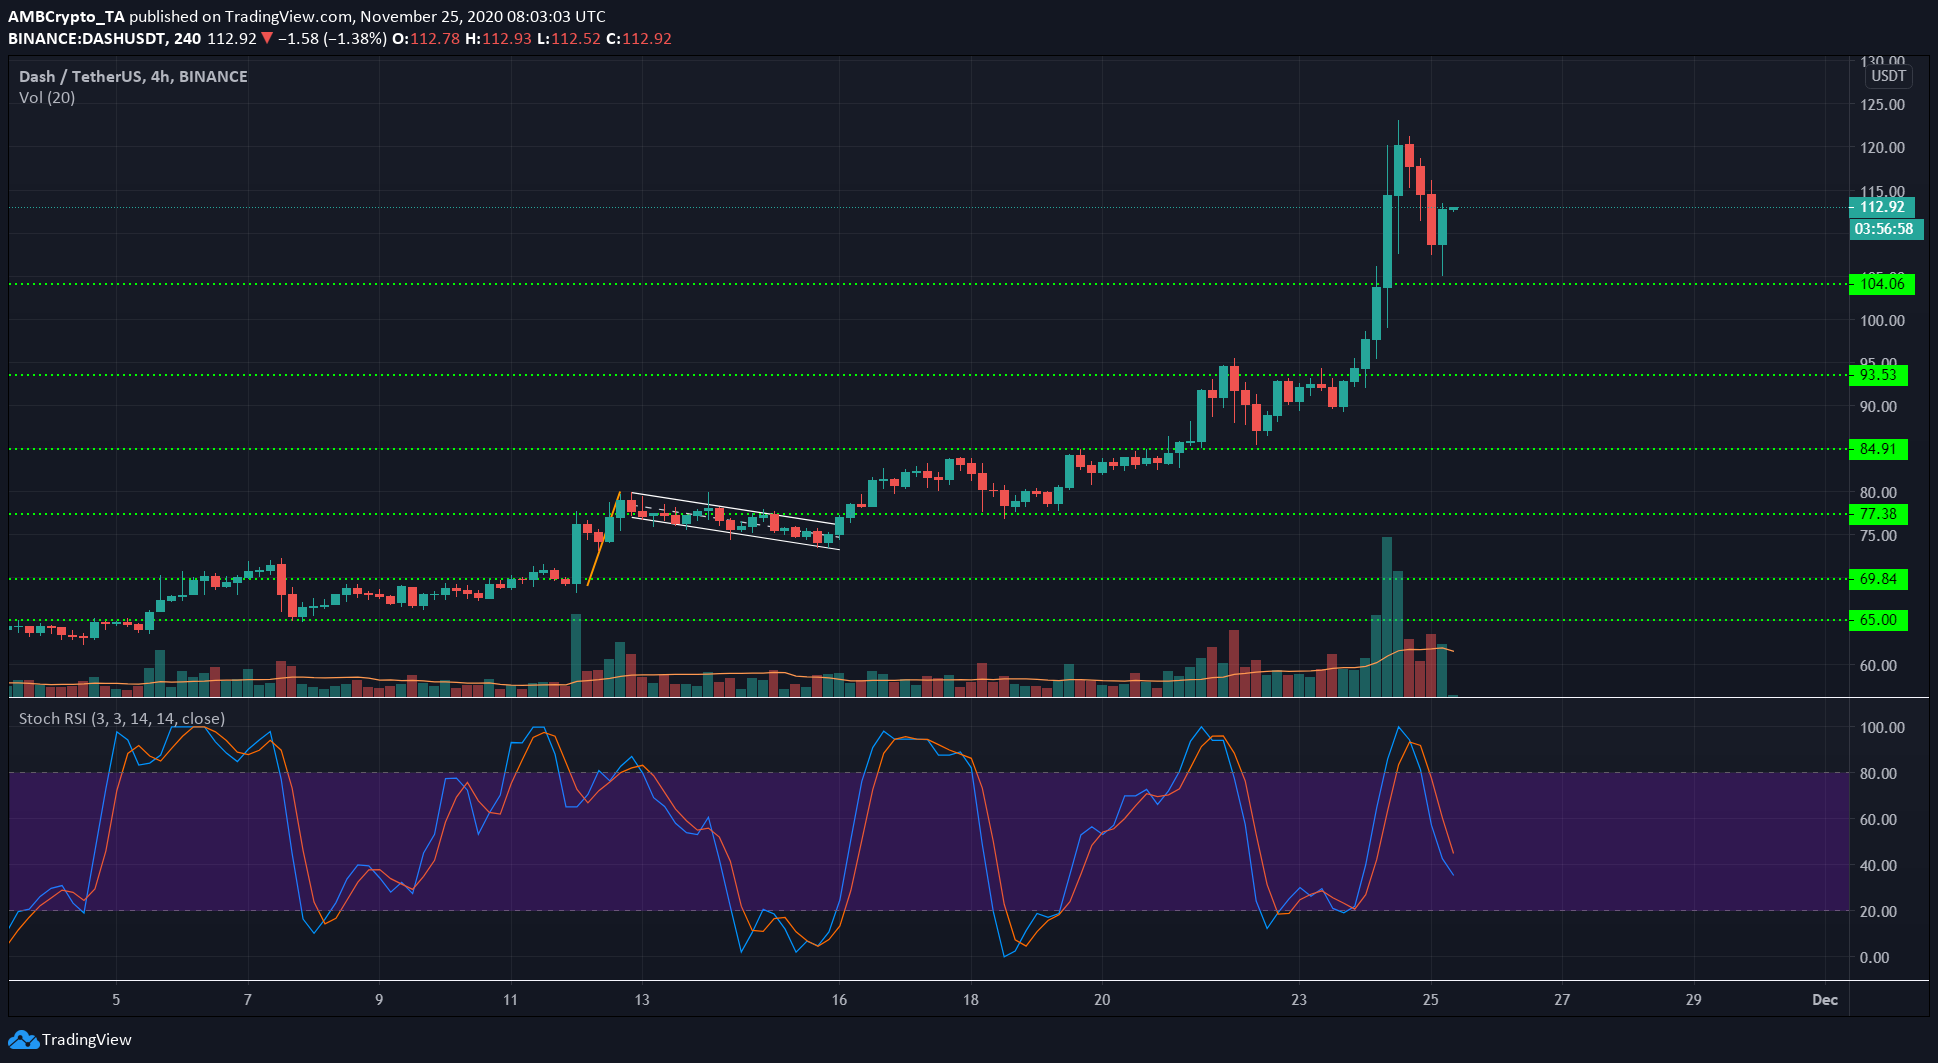
DASH was trading at $112 at press time following a candle wick that was down to $104. The Stochastic RSI was moving lower and could see the price dip toward $100 once more.
The trend is strongly bullish and this was only a pullback for DASH. The selling volume has not been impressive, hence this dip will offer traders the opportunity to add to long positions.
It was unlikely that DASH would drop below $105 and $100 in the coming hours. DASH appeared to form a bull flag and a breakout beyond $114 on strong trading volume could see price reach $135 in the coming days.
Basic Attention Token [BAT]

Source: BAT/USD on TradingView
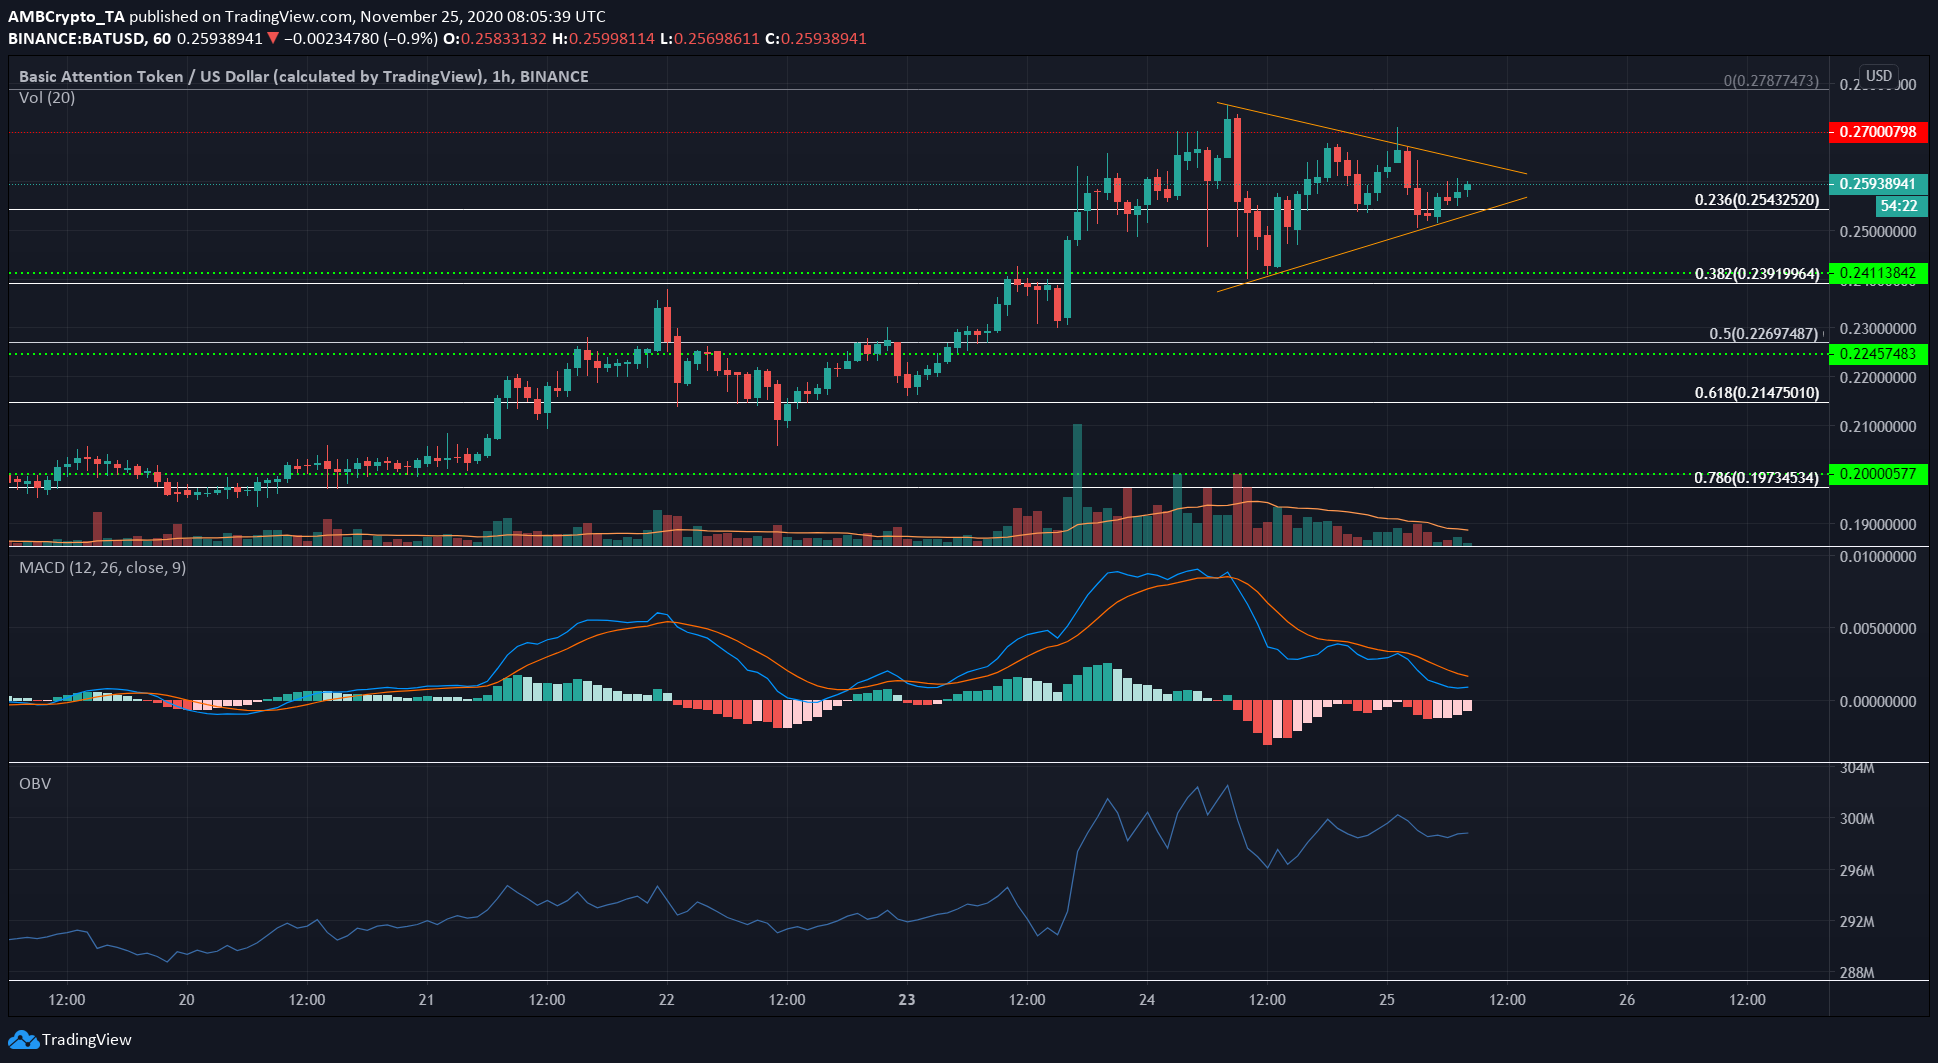
BAT formed a symmetrical triangle on the hourly chart after finding support at the 23.6% retracement level of $0.25. The trading volume has been falling over the past few hours, to give credence to the triangle-pattern formation.
The MACD had formed a bearish crossover but was above the zero line. This indicated weak bearish pressure.
The OBV showed that there was not much selling volume after the recent surge, hence the price was likely gathering steam for another move upward.


