XRP, BAT, Crypto.com Coin Price Analysis: 11 October

The Crypto Fear and Greed Index stood at 55 on a day when Bitcoin bulls were attempting to push its price past $11,400. XRP showed signs of bullishness on the chart too, and interest from buyers in the crypto-asset could rise over the coming days as it also appeared to be on the verge of a breakout from a long-term descending channel.
Further down the charts, Basic Attention Token recorded moderate gains but might note some southbound movement on the charts soon. Finally, Crypto.com Coin might be poised to rise past its level of resistance.
XRP

Source: XRP/USD on TradingView
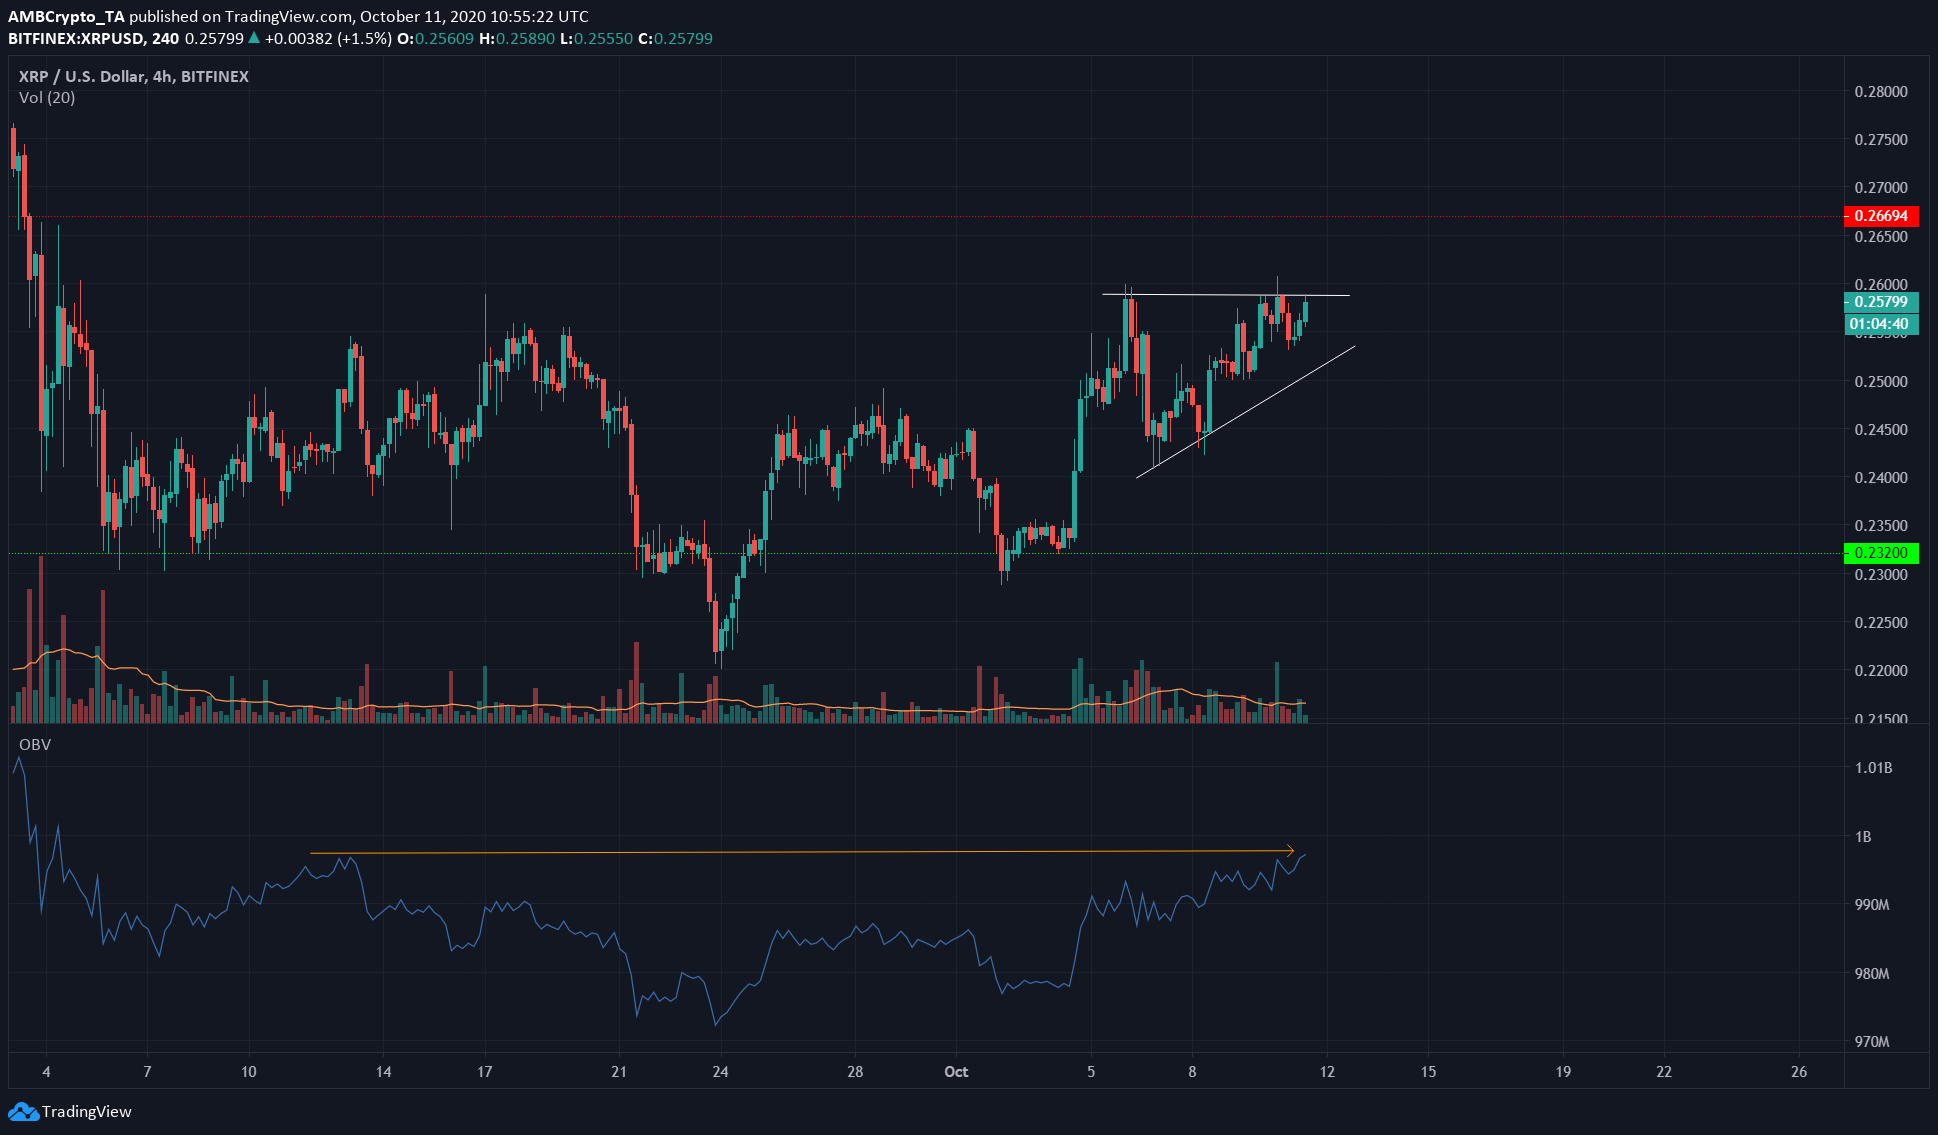
XRP was forming an ascending triangle pattern (white) on the charts, a formation that usually sees a breakout to the upside. A candlestick close above the upper trendline can be considered as confirmation before placing a trade, with $0.270 as the target.
The OBV showed that in recent weeks, buying volume has been in balance with the selling volume, that is, there was no trend present. This was very similar to the price that has been caught between $0.256 and $0.232. A break above the orange trendline would signal rising buyer interest in the crypto-asset.
In related news, Ripple’s long-time business partner and Japanese financial services company SBI Holdings recently announced that they would be holding an STO using the Ibet blockchain platform.
Basic Attention Token [BAT]

Source: BAT/USD on TradingView
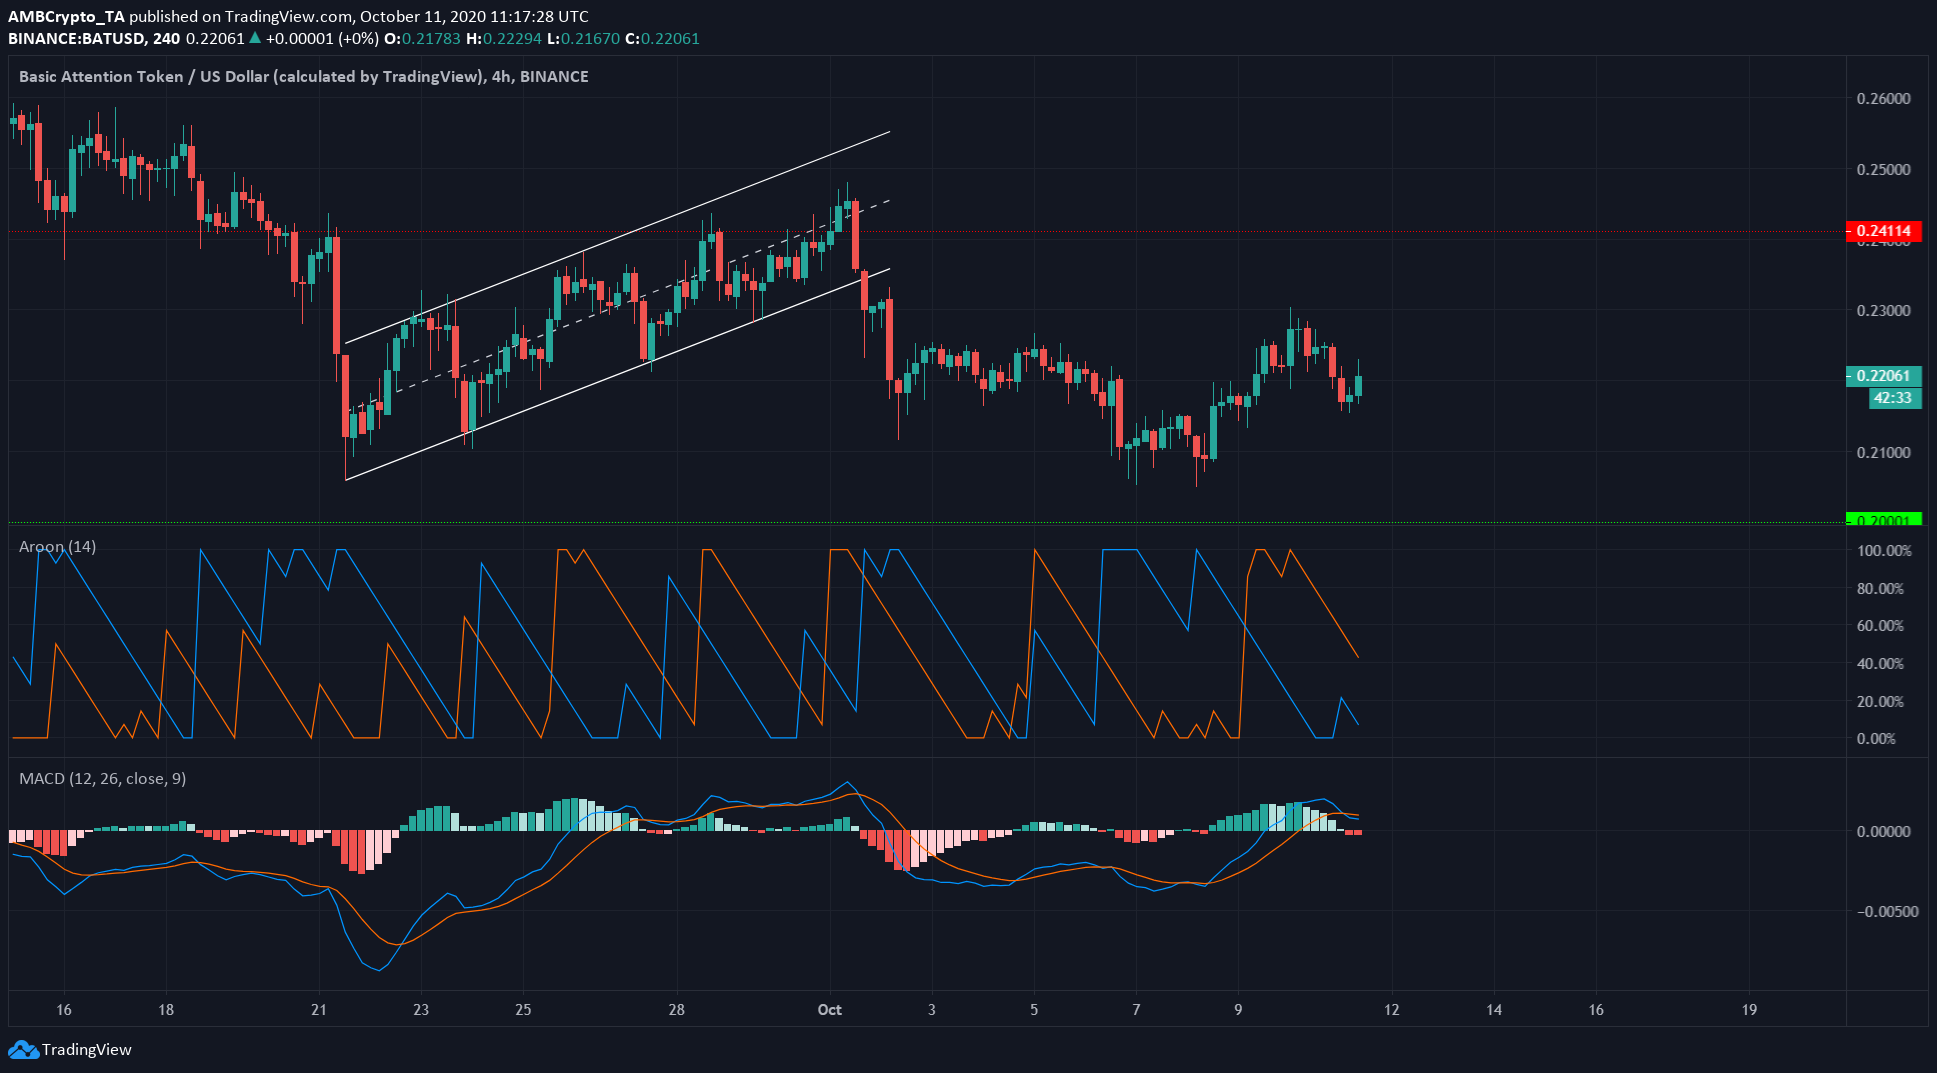
Basic Attention Token found support at $0.2 and surged by nearly 10%, before trading at $0.22, at the time of writing. While the trend on a longer timeframe was downward, there might be some more gains to be had in the short-term.
Further, the Aroon Indicator did not yet exhibit a bearish signal, although the move upwards was shown to be losing strength. The MACD formed a bearish crossover above zero. This was a weak sell signal, and a trading session close beneath $0.216 could signify the end of the brief move upwards.
Crypto.com Coin [CRO]

Source: CRO/USDT on TradingView
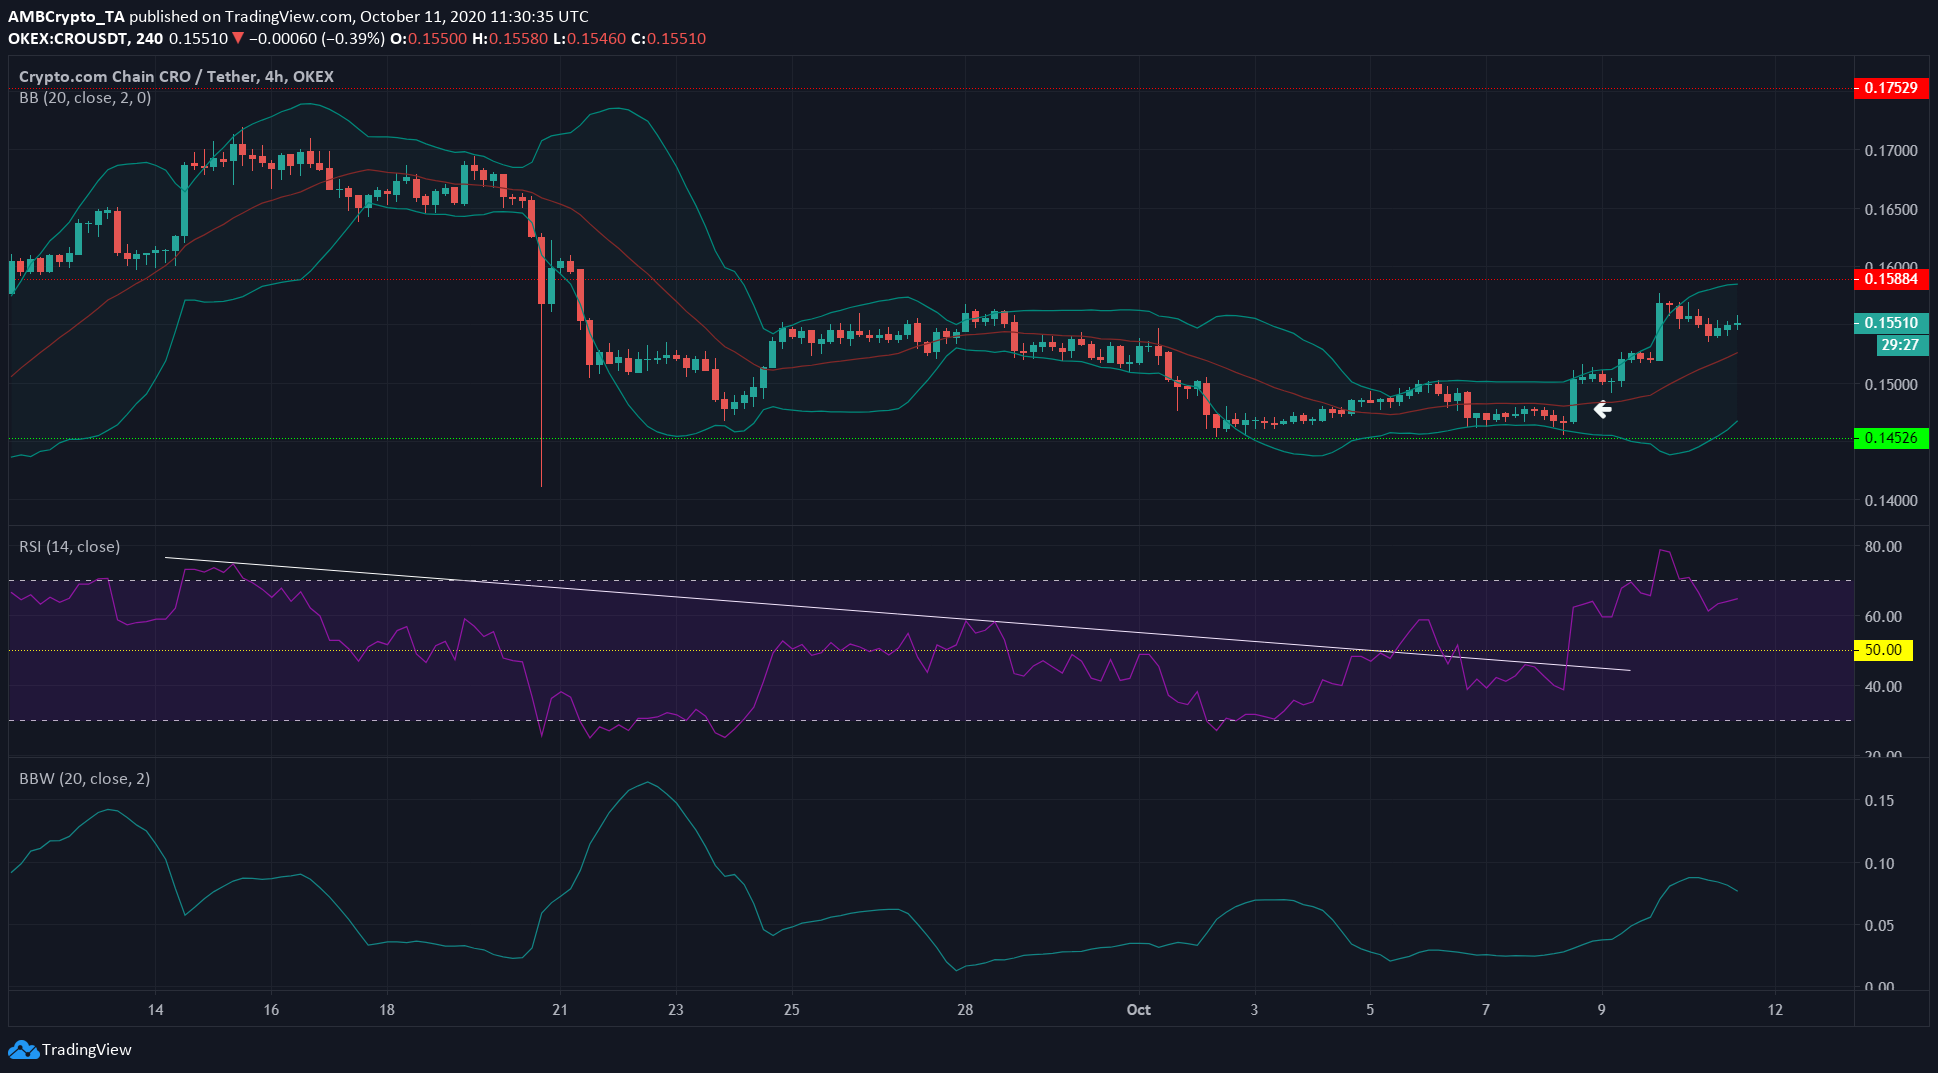
On the RSI, a downtrend (white) was shown, before it broke out alongside the price. The Bollinger Bands also pointed to heightened volatility at the time, with the Bollinger Bands’ width rising from 0.03 to 0.09.
The breakout by price was indicated by a white arrow on the charts.
When a similar trendline was drawn from $0.156 on the 27th to price a few hours previously, the breakout can be observed. Such a move is more likely to indicate a legitimate breakout, rather than a fakeout.


