Analysis
XRP awaits price rise as ascending triangle asserts dominance

Bitcoin’s price movement has an impact on the performance of most altcoins in the market, and the same was observed in October when its rise led to the growth of XRP. However, XRP was unable to maintain the growth and noted an immediate correction. The price of XRP was stable at $0.3006 with a market cap of $13.06 billion, at press time; however, the market might see a bullish wave hitting soon.
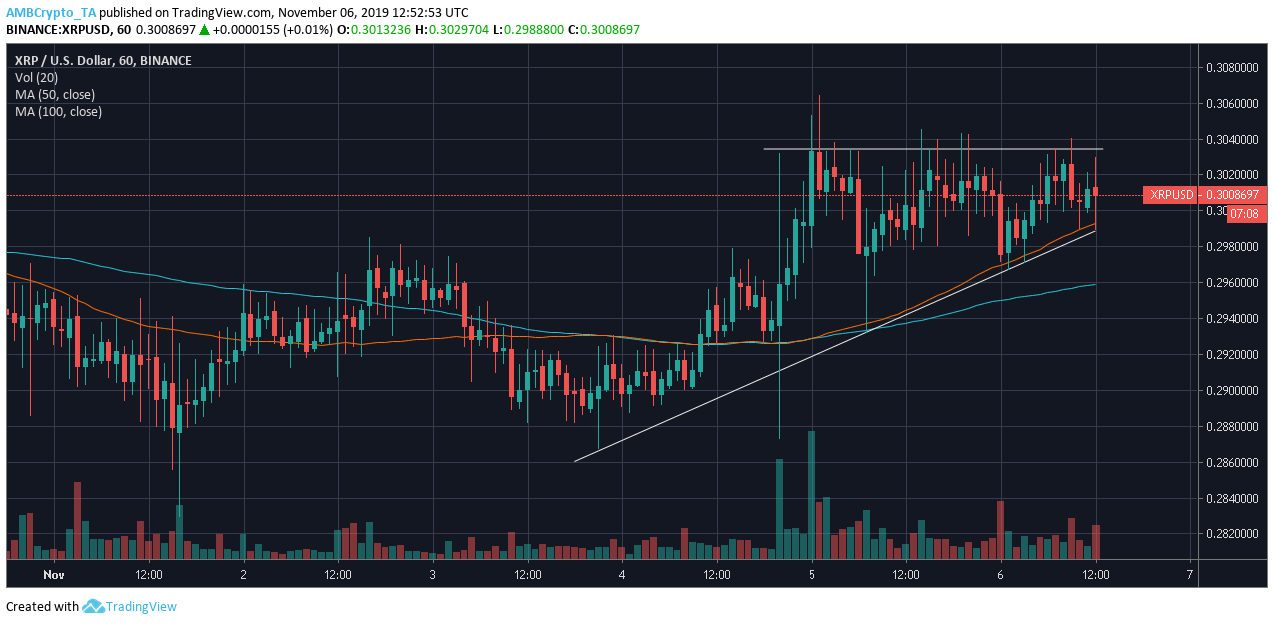
The short-term chart of XRP predicted a boost in the coin’s price as it formed a bullish pattern.
1-hour

Source: XRP/USD on Trading view
The hourly chart of XRP indicated formation of an ascending triangle that extended since the beginning of November. This bullish pattern noted a rising price of the third-largest asset and marked the higher lows at $0.2867, $0.2933, $0.2967, and $0.2989, while the base of the triangle was noted at $0.3034. In accordance with the nature of the pattern, the triangle might break toward the bullish end of the market.
50 moving average was above the 100 moving average, while the averages aligned under the candlesticks indicating a strong bullish momentum in the XRP market.
Source: XRP/USD on Trading view
MACD line was observed close to the signal line, as it was on the verge of a bullish crossover, negating the minimal bearish momentum. Relative Strength Indicator [RSI], reflected that the buying and selling pressures had reached equilibrium.
Conclusion
As the market gains bullish strength, XRP’s price may notice an upward spike with the breach of the ascending triangle pattern. This breach might free the price of XRP from the $0.29 zone, however, the next resistance lies close to $0.3114.

