Ethereum
Why Ethereum’s move above $2K may not last
Amidst rising sell pressure on ETH, a key indicator suggests that the altcoin might witness a correction.
- ETH was up by nearly 4% in just the last 24 hours.
- Its RSI was overbought, but Open Interest looked bullish.
Ethereum [ETH] once again initiated a bull rally as its price jumped above the $2,000 mark in the last 24 hours. Though this gave investors hope for a further rise in value, a key metric was flagging a sell signal.
Will Ethereum again fall below the recently achieved mark in the coming days?
Ethereum is near a key resistance level
After a relatively quiet week, Ethereum’s price gained bullish momentum. According to CoinMarketCap, ETH’s price stood at $2,057.71 at press time, with a market capitalization of over $247 billion.
However, ETH might encounter a strong resistance level in the coming days, which could cause a drop in its price. Ali, a popular crypto analyst, recently pointed out through a tweet that ETH’s TD Sequential was flagging a sell signal on the token’s three-day chart.
The TD Sequential is a technical analysis tool used to identify the time of trend exhaustion and potential price reversals.
#Ethereum | TD Sequential is flagging a sell signal on the $ETH 3-day chart! This comes as #ETH tests a major resistance zone between $2,000 and $2,150, aligning with the x-axis of an ascending triangle pattern.
A pullback from this resistance level could lead to a dip toward… pic.twitter.com/oKGCT6tVrj
— Ali (@ali_charts) November 15, 2023
As per Ali, Ethereum will test a major resistance zone between $2,000 and $2,150. A pullback from this resistance level could lead to a dip to around $1,700. Once that support level is reached, ETH could then initiate another bull rally.
Interestingly, when AMBCrypto checked ETH’s liquidation levels, a similar picture was painted. Notably, ETH’s liquidation increased near the $2,100 mark, and ETH was once again on the verge of testing that level.
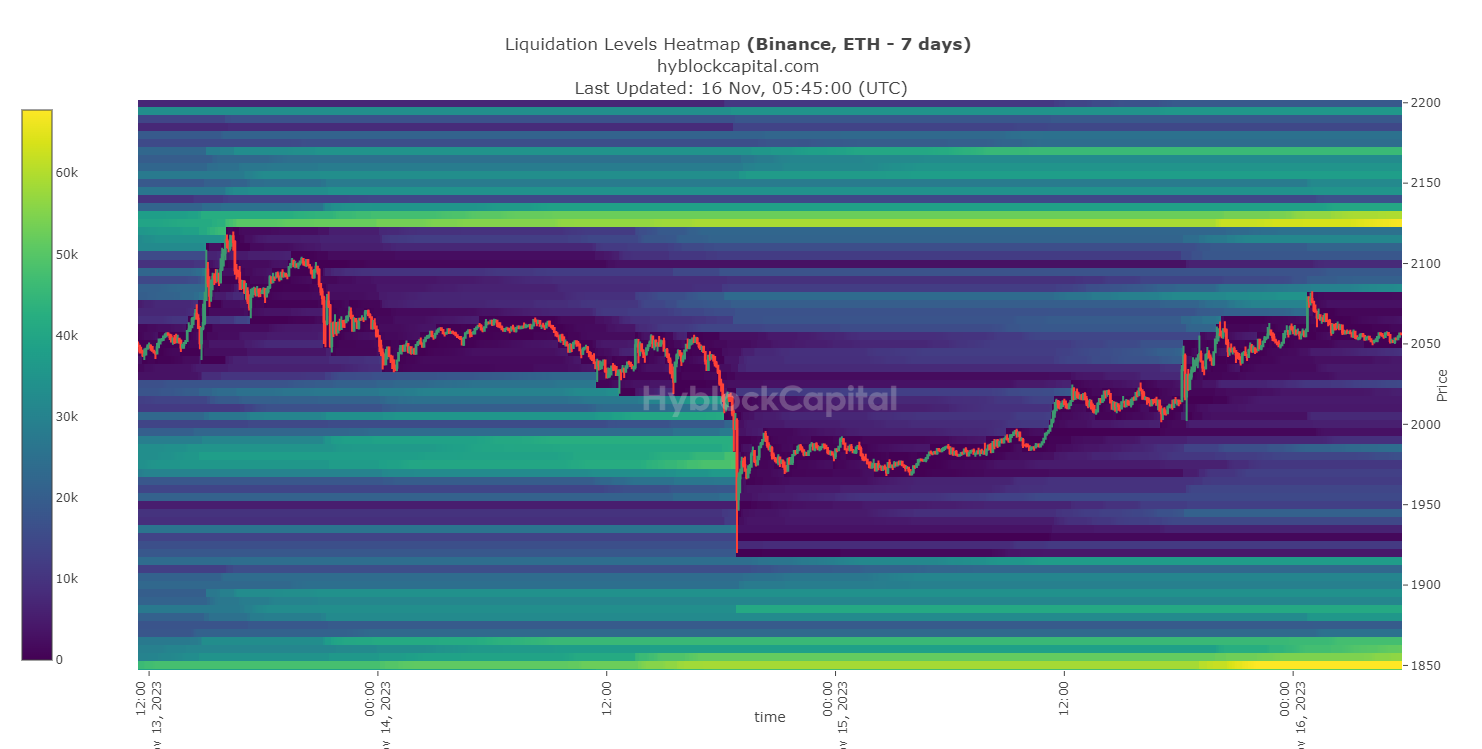
Source: Hyblock Capital
Is a price drop in the short term likely?
AMBCrypto’s analysis of CryptoQuant’s data suggested that selling pressure on the token has already increased. ETH’s exchange reserve was up.
Both Ethereum’s Fund premium and Korea premium were red, meaning that Korean retail investors and investors in funds and trusts, including Grayscale, had relatively weak buying sentiment.
Additionally, ETH’s Relative Strength Index (RSI) was in an overbought zone, which can further increase selling pressure. These metrics suggested that the possibility of a price correction in the near term was high.
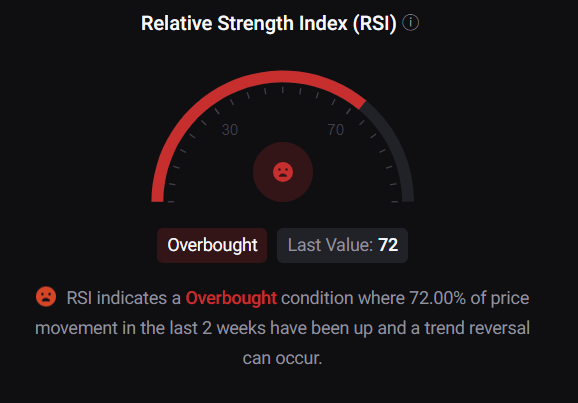
Source: CryptoQuant
Is your portfolio green? Check out the ETH Profit Calculator
However, there were chances of ETH continuing its uptrend. When AMBCrypto checked Coinglass’ data, we found out that ETH’s Open Interest rose along with its price. Whenever Open Interest goes up, it indicates that the current price trend will continue.
Therefore, we might witness ETH touching the $2,150 mark before it undergoes a price correction.
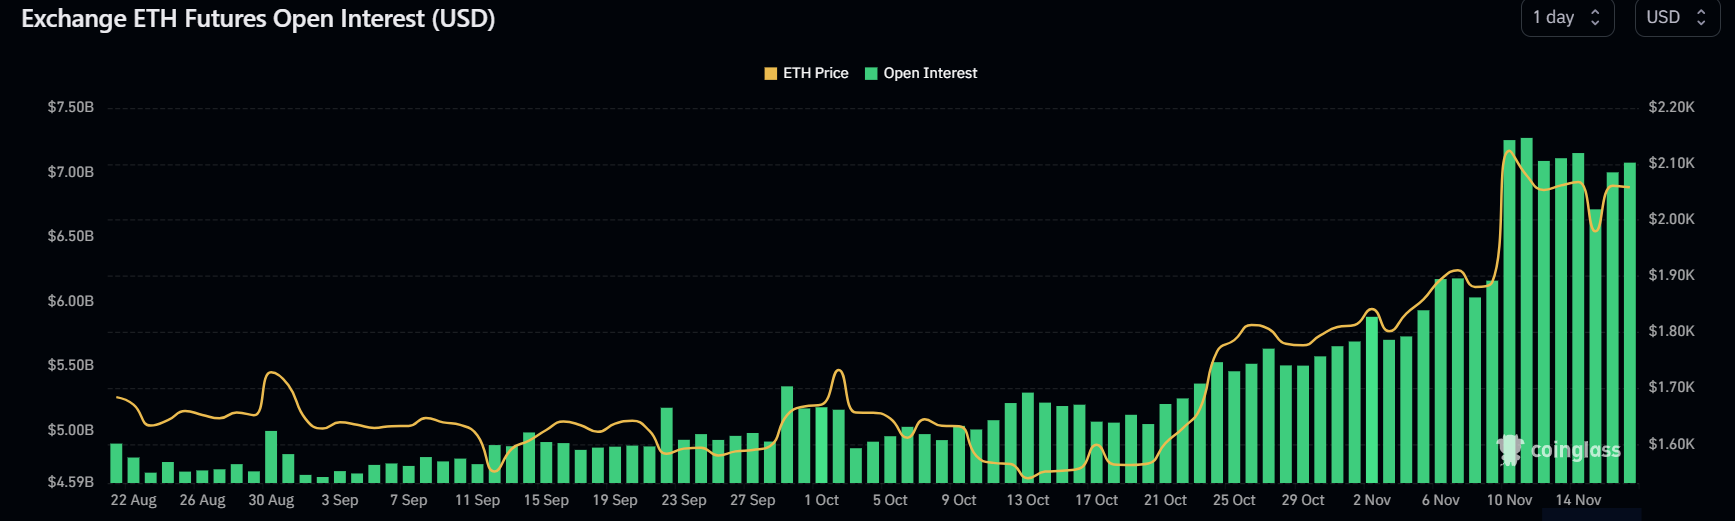
Source: Coinglass