Bitcoin

Why Bitcoin’s volatility is falling, despite the drop to $17k
Posted:
| Last updated: December 19th, 2023

This past week has been one heck of a ride, and that’s by Bitcoin standards. After rising to over $19,000 for the first time since December 2017, teasing close to the ATH, Bitcoin crashed by nearly $3,000 in two days, and left the same old dinner conversation open – ‘Bitcoin’s too volatile to invest in.‘
Well, there’s some truth in that statement, but just how volatile is it? And was this past week’s volatility right up there? Let’s take a look.
On average between November 21 to November 27, Bitcoin’s weekly price deviation was about 3 percent, which is about $550 given where the price was at the peak of this week. This means that on average, for each day of this week, Bitcoin shifted (either up or down) by 3 percent. That’s a lot by regular market standards, but not so much looking at the cryptocurrency’s price history.
For instance, let’s look at the standouts. In the last week of September, Bitcoin crashed by nearly $1,500 on the back of a poor opening by Bakkt. Two months later as thin news emerged on China’s positive outlook to blockchain (not Bitcoin), the cryptocurrency’s price jumped by over $1,000. Who can forget earlier this year when the price crashed by over 50 percent in a single day, or the mammoth run between mid-September 2020 to last week when the price jumped from $13,000 to $19,000.
Now, let’s talk numbers, and look at the big picture. Between January 2018 to the last week, the average weekly deviation in Bitcoin’s price is 2.7 percent of the average price of the week. However, this is from a high of 11 percent to a low of almost 0 percent. The top-10 most volatile weeks since January 2018 were,
| Date | Deviation |
| 14-Feb-18 | 11.0% |
| 28-Nov-18 | 10.9% |
| 14-Mar-18 | 10.4% |
| 28-Jun-19 | 10.3% |
| 14-Jul-19 | 9.8% |
| 21-Jan-18 | 9.5% |
| 7-May-20 | 9.0% |
| 14-Nov-18 | 9.0% |
| 28-Dec-18 | 8.7% |
| 14-Jan-20 | 8.4% |
Once again, to put that in context, this week saw a change of 3 percent. That makes this week the 47th most volatile week since January 2018, out of 141 weeks, that’s not very volatile, is it? Here’s how the weekly price deviation has changed since January 2018.
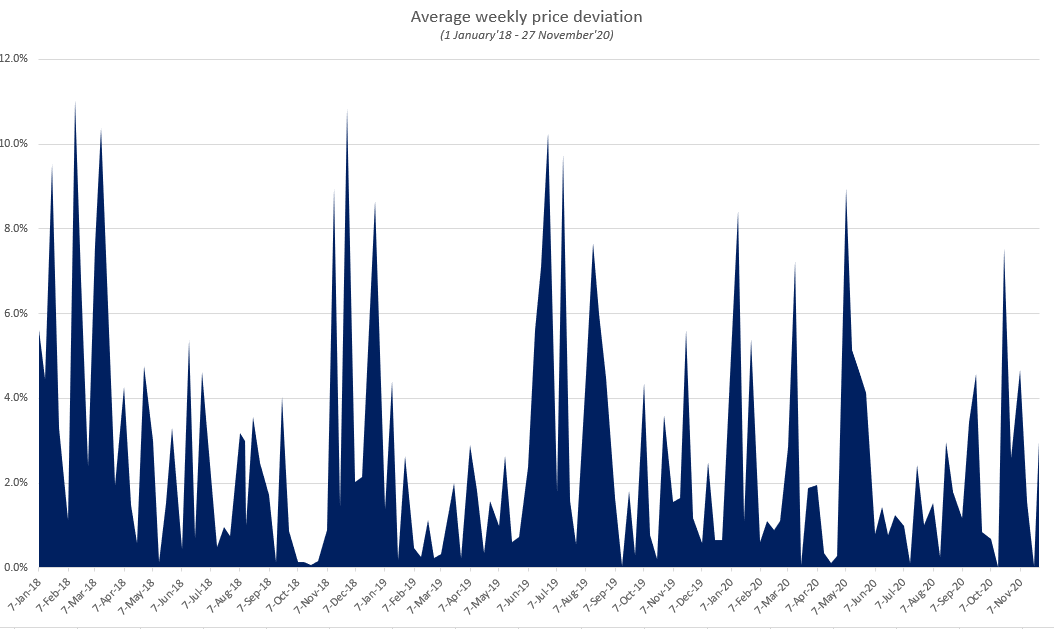
Despite the recent spike being quite high, you’d notice it’s not even the highest since October. That’s because in the last week of October as the price was rising, the weekly deviation has been jumping, as high as 7.8 percent for the week ended 21 October. Further, notice the highs since the conclusion of 2018. Only once did the weekly price deviation go above 10 percent. Since the halving, on May 12, the average price deviation has been 2.2 percent, lower than the average for the entire period (2.7 percent) and lower the average since the year began (2.4 percent).
Finally, despite the rally of the recent months and the crash from the almost ATH in the past week, Bitcoin has been trading with decreasing volatility for longer than it has been in this bull market.