
Disclaimer: The information presented does not constitute financial, investment, trading, or other types of advice and is solely the writer’s opinion.
- Optimism has performed well both on the price charts and in DEX metrics.
- The retest of a long-term resistance could see OP rejected.
Optimism [OP] faced challenges due to the state of the L2 sector. A recent AMBCrypto report dived deeper into these implications and how the DEX was able to thrive despite the competitive environment.
The weekly trading volume on Optimism also saw a massive spike recently before falling toward the mean. However, the Total Value Locked continued to grow. A look at OP’s performance on the price charts could shed more light.
The retest of the range highs did not see bulls victorious yet
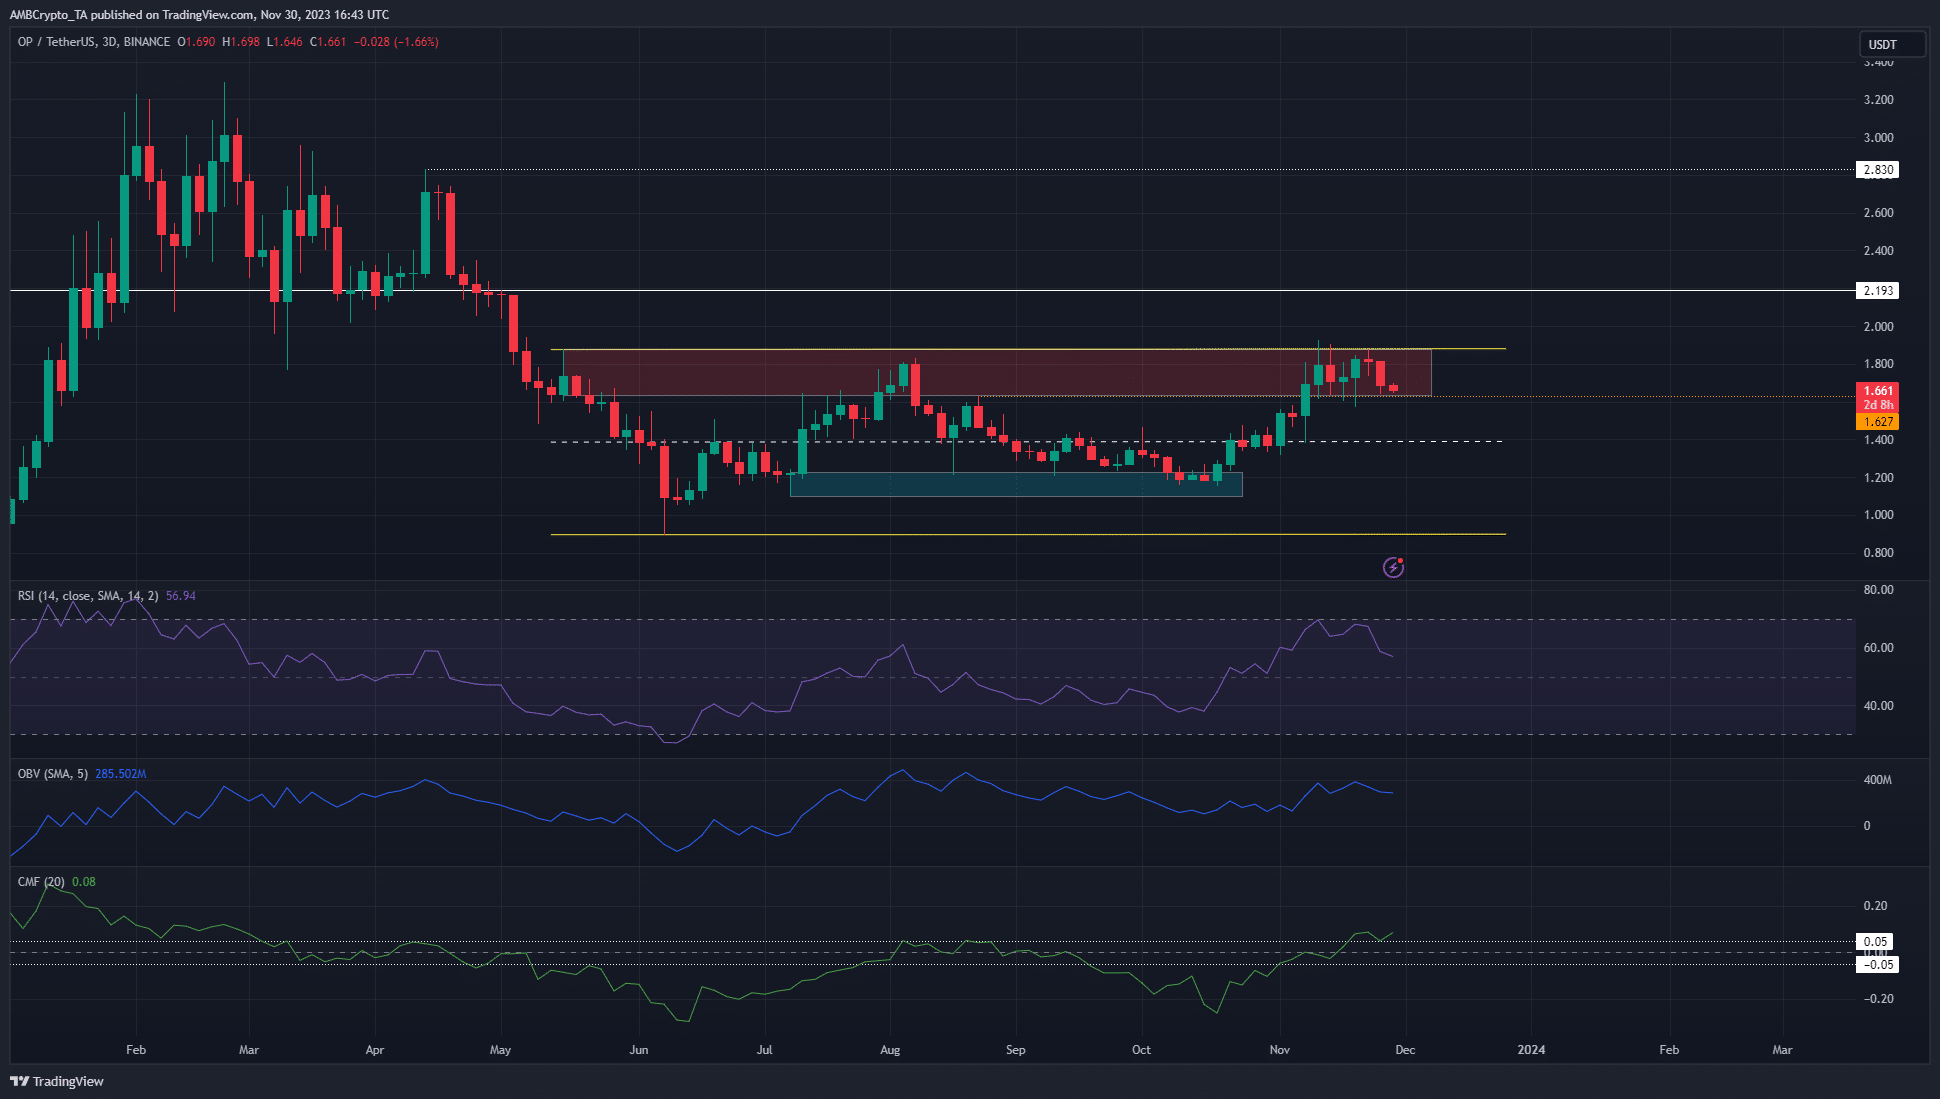
Source: OP/USDT on TradingView
Optimism has traded within a range (yellow) since May that extended from $0.895 to $1.87. Although the market structure on the three-day chart remained bullish and the RSI showed strong upward momentum, a move past $1.9 might not materialize.
The On-Balance Volume (OBV) has not established new highs since August. This showed buying volume was not dominant.
However, the Chaikin Money Flow (CMF) climbed above +0.08 to signify heavy capital inflow to the OP market.
The bearish order block at $1.8 continued to resist the bulls’ efforts. A one-day trading session close above $1.88 would be needed before we can expect another uptrend past $2.
The social volume recovered after the dip last month, sell pressure was not high yet
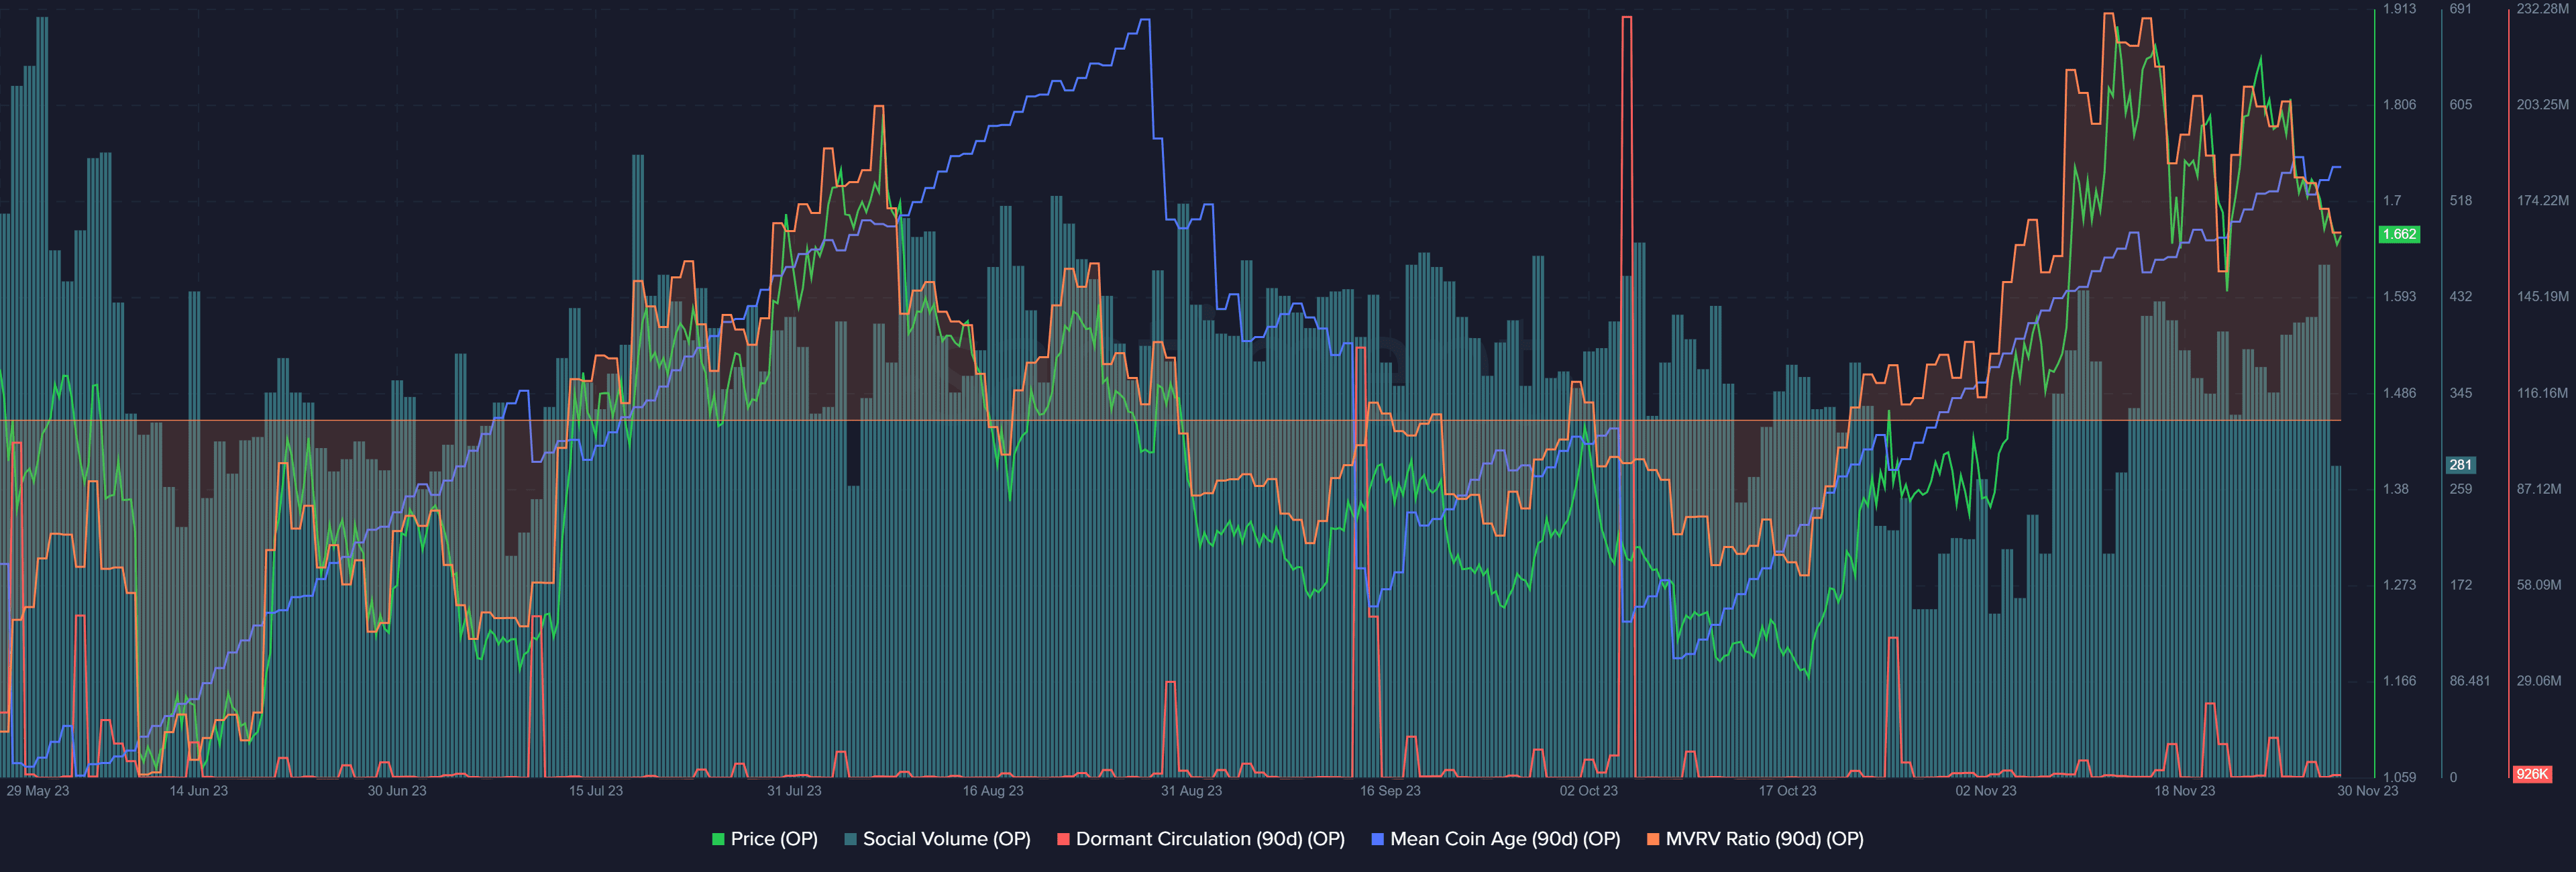
Source: Santiment
Although OP was at a major higher timeframe resistance, its dormant circulation did not see notable spikes in recent days.
The mean coin age also continued to trend higher, showing that accumulation was in progress. The social volume also trended higher over the past month.
Is your portfolio green? Check the OP Profit Calculator
This meant OP holders were not yet looking to sell. A spike in dormant circulation would be an early sign of that.
The MVRV ratio was high and was near the late July highs. Overall, a sudden surge in selling pressure has not yet seen.