The Crypto Fear and Green Index noted a reading of 53 on the day when Bitcoin, the world’s largest cryptocurrency, surged past $11k to trade at $11,376, at press time. Tron, whose recent movements have been bearish, was yet to signal a reversal on the charts. Further down the line, while Waves could be poised to make further gains after its price seemingly bottomed, FTX Token appeared to break out of a month-long downtrend.
Tron [TRX]
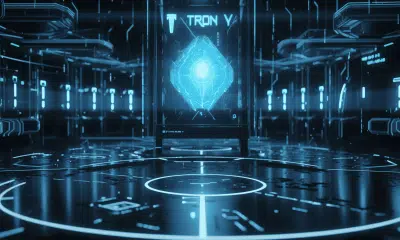
Source: TRX/USDT on TradingView
Tron has been setting a series of lower highs since mid-September. In the short-term also, the prevailing downtrend seemed to have persisted. However, Tron did not note a lower low recently, a probable sign of a shorter-term uptrend.
It can be expected that the longer-term trend would win, however, unless TRX sets a higher high. The MACD also formed a bullish crossover and moved upwards past zero, giving a strong buy signal.
The Parabolic SAR also generated a buy signal. The 20 SMA (white) was moving beneath the 50 SMA (yellow), but a bullish crossover was not unlikely in the next few trading sessions.
Waves [WAVES]
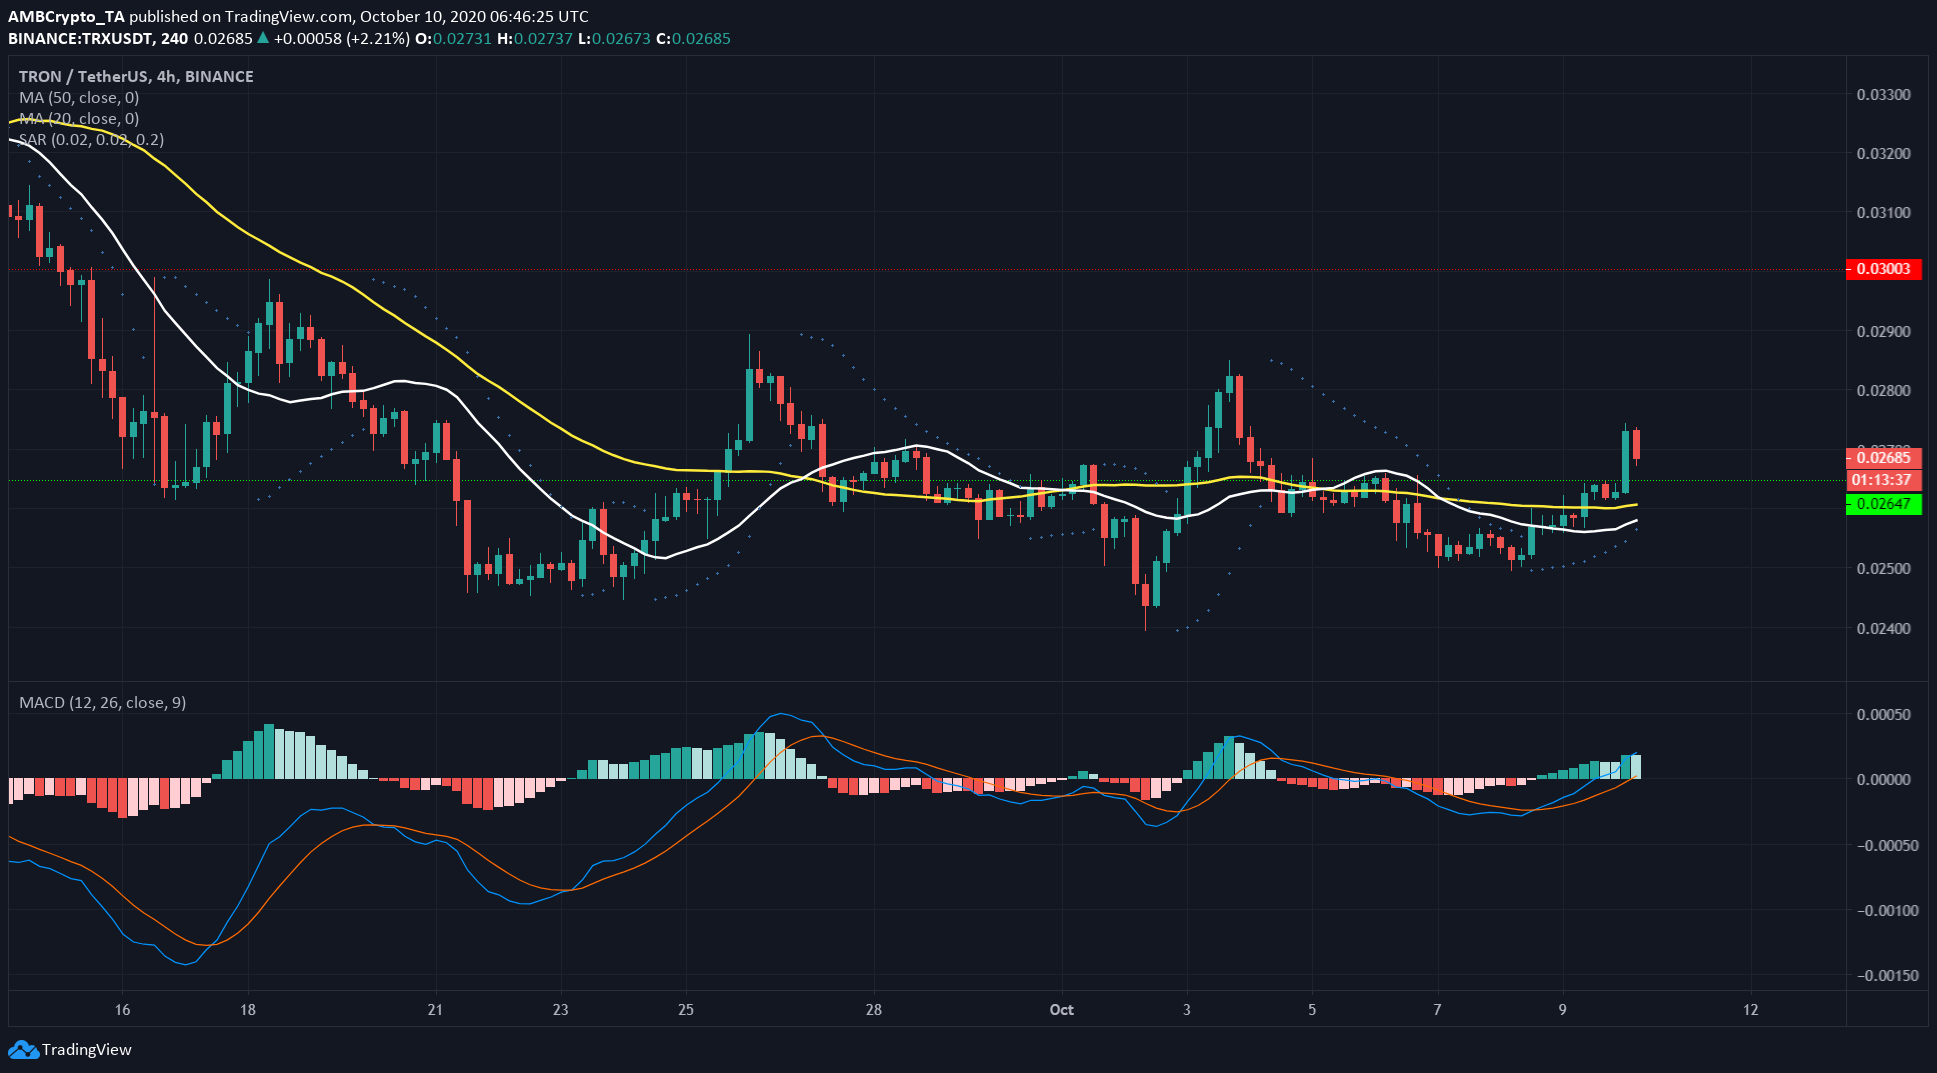
Source: WAVES/UDST on TradingView
Shown in white, a double bottom pattern could be seen on the charts. While this pattern is generally more reliable over a higher time frame, the price action following the pattern seemed convincing.
The pattern’s peaks were within 3% of one another, with the crest between the two troughs 9% higher in value than the lowest point of the formation.
This suggested that WAVES would reach $2.5 in the next few trading sessions. Further, the Awesome Oscillator also registered a shift in momentum toward bullish.
FTX Token [FTT]
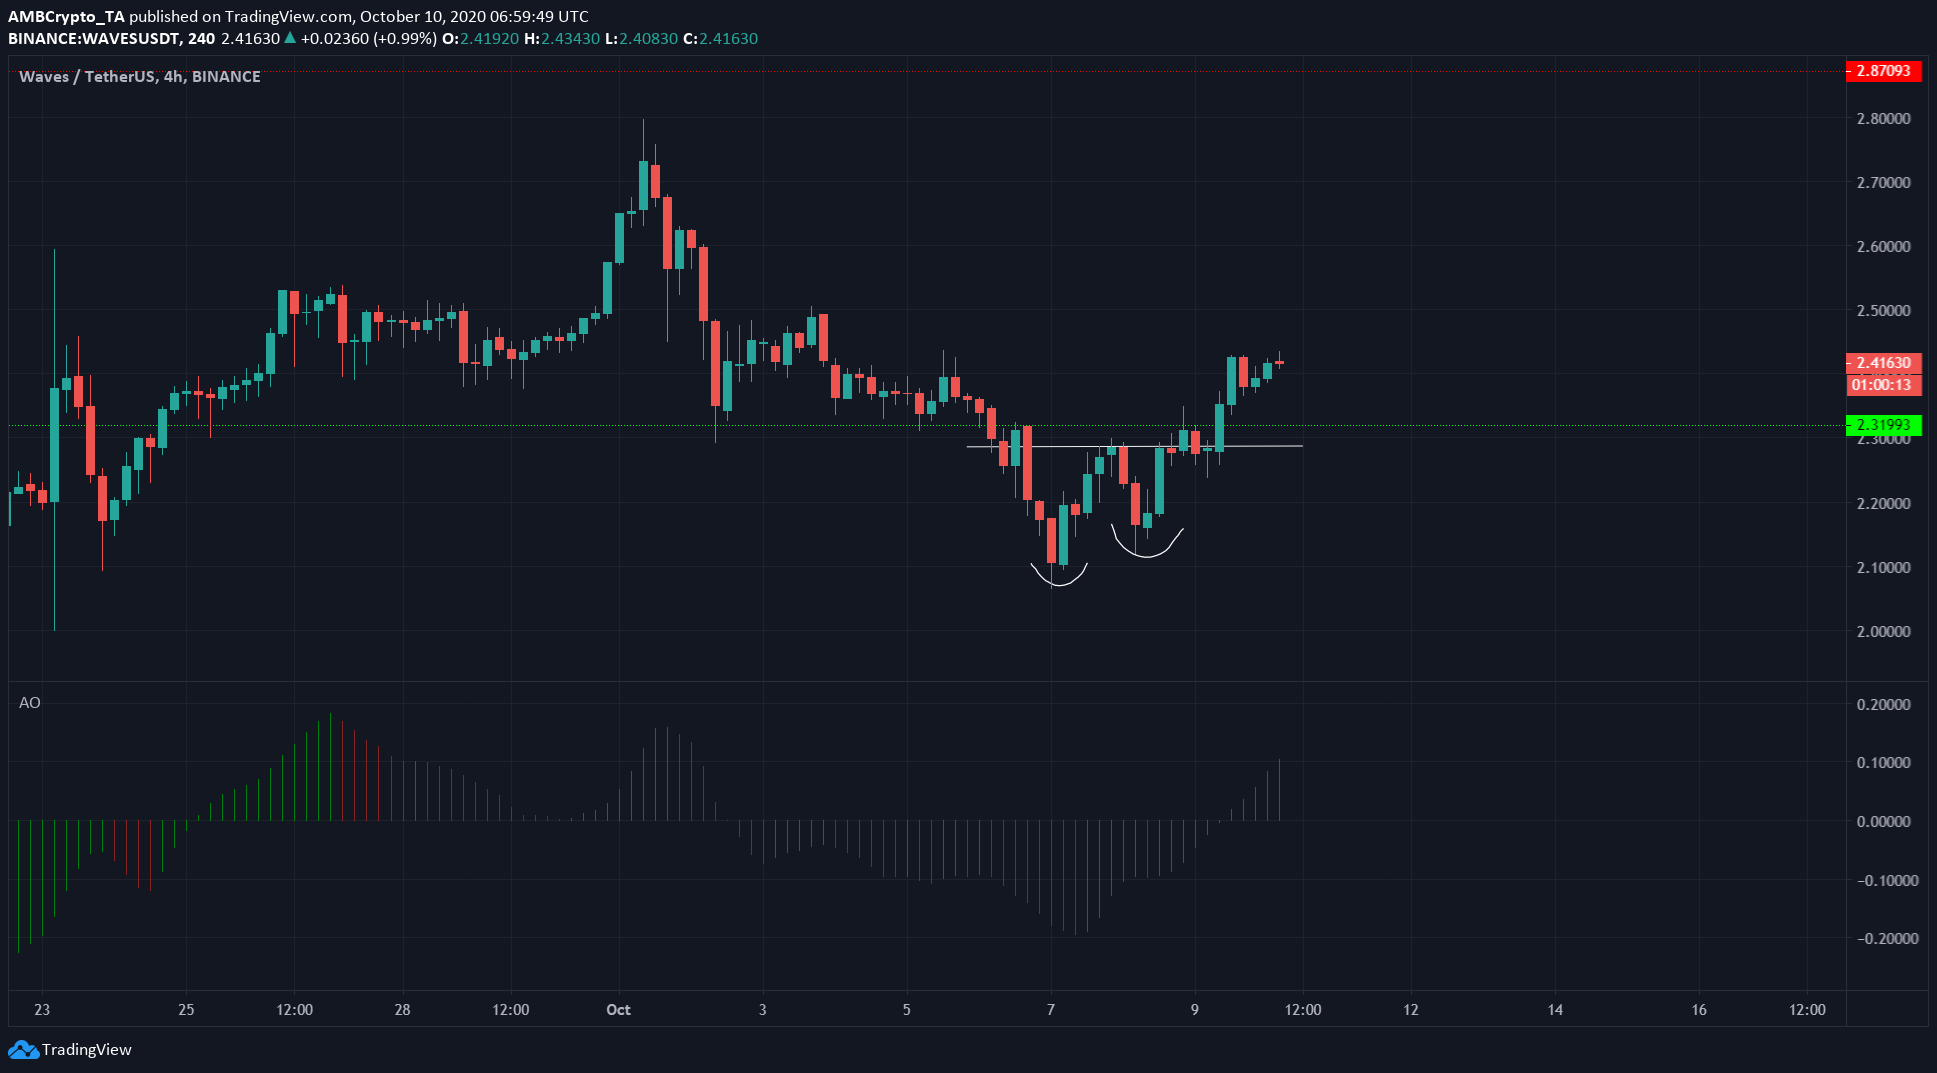
Source: FTT/USD on TradingView
The white descending trendline captured the general downtrend of the past month. Very recently, FTT broke out to the upside of this trendline resistance.
It faced a level of resistance at $3.66, and $3.88 past that level. However, in the short-term, as shown by the Aroon Indicator, an uptrend was established and the price moved upside of the longer-term trendline resistance.
In conclusion, this was bullish for FTT whose further performances also hinged on the general market outlook.