
Bitcoin’s recent surge that saw it climb to a new ATH on a few exchanges had a profound effect on the rest of the crypto-market. At press time BTC was being traded at $19,403 with a trading volume of $17.5 billion.
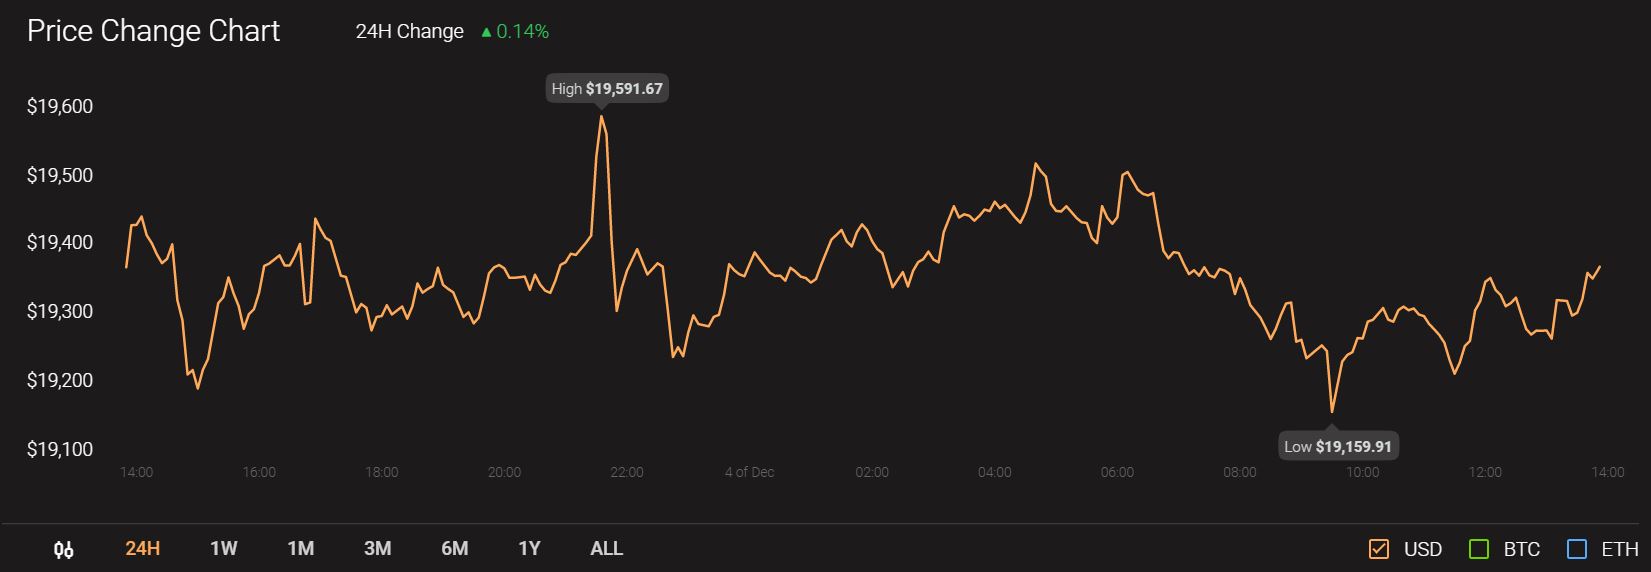
Source: CoinStats
Thanks to BTC’s high correlation with the rest of the market, many altcoins surged, including the likes of IOTA and Tezos. Crypto.com Coin, on the contrary, seemed to follow its own bearish trajectory on the charts.
Tezos [XTZ]
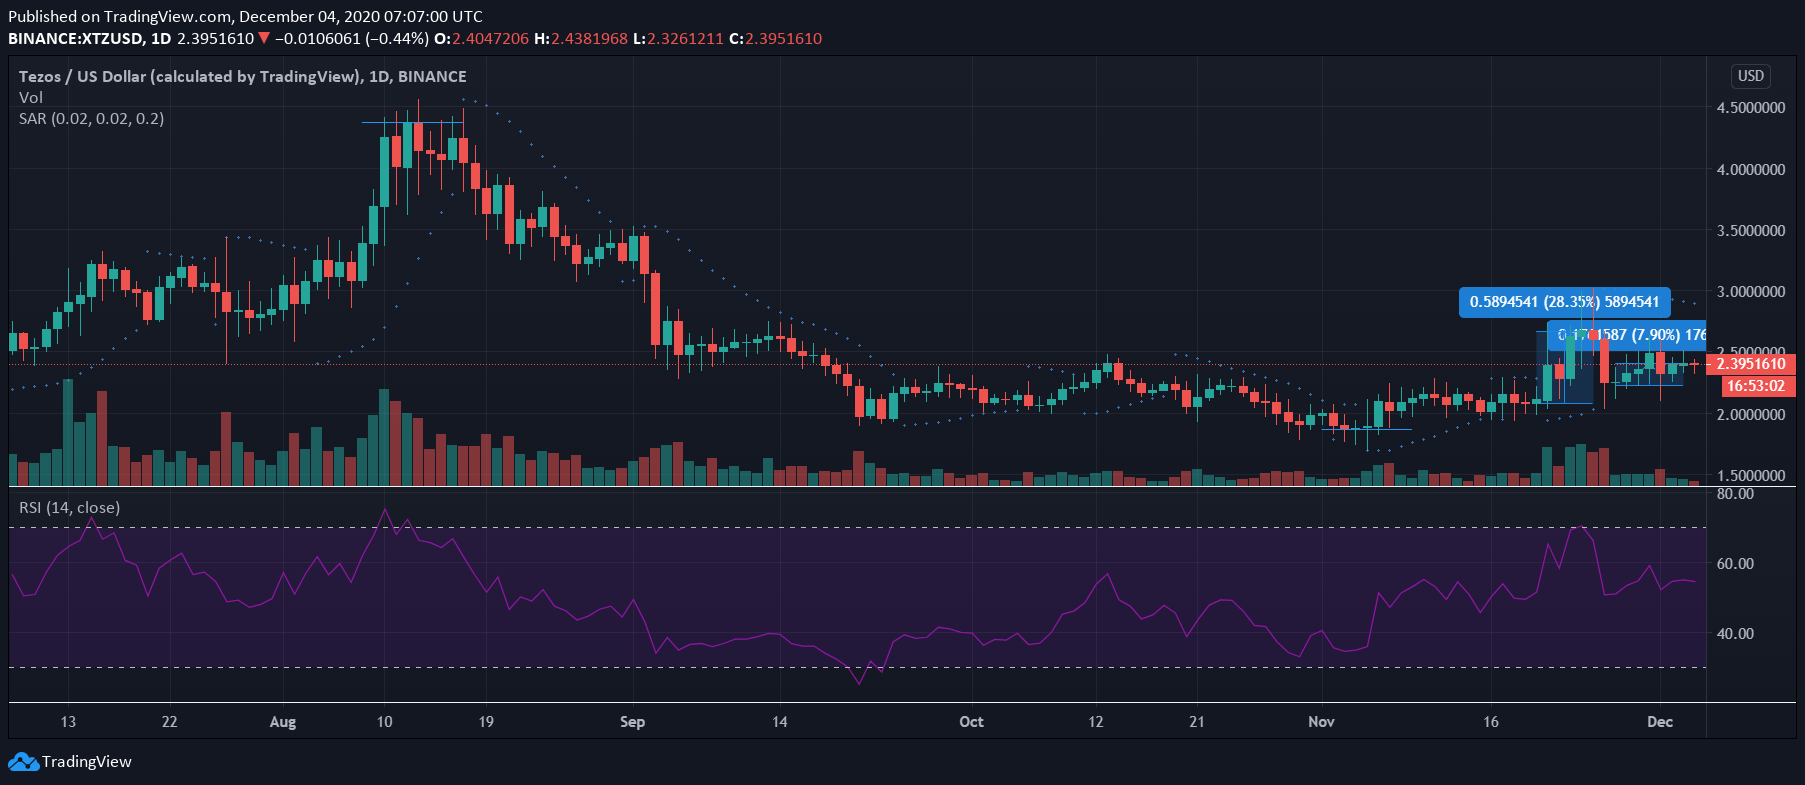
Source: XTZ/USD on TradingView
Tezos, once one of the market’s top-12 cryptocurrencies, has fallen a long way on the charts since mid-August. In fact, at the time of writing, Tezos was ranked 19th on CoinMarketCap’s ladder. However, despite its bearishness over the last few months, the last few weeks have seen signs of bullish revival. The same was true over the previous week as XTZ surged by almost 8% on the charts after Bitcoin’s latest ATH.
It should be noted, however, that this hike paled in comparison to the one it noted the week before that. At the time, Tezos was observed to have climbed by almost 30%.
While there were some bullish signs, the larger trend remained bearish, something suggested by XTZ’s technical indicators too. While the Parabolic SAR’s dotted markers were well above the price candles, the Relative Strength Index was mediating between the oversold and overbought zones.
Tezos was in the news recently after it announced the Edo upgrade, swiftly on the heels of the Delphi upgrade.
IOTA
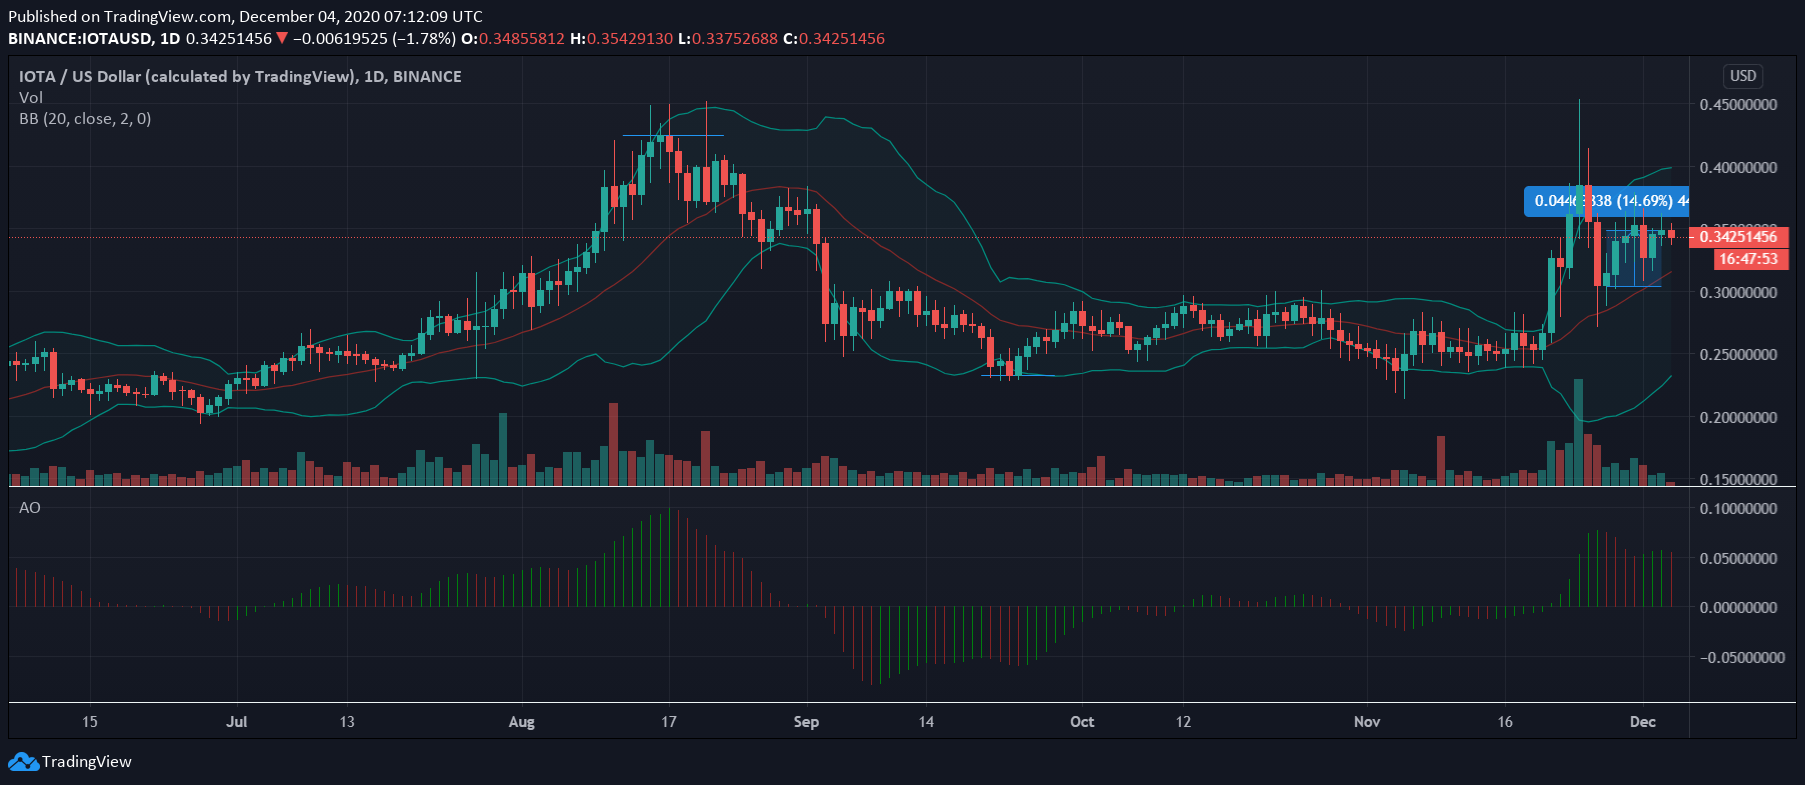
Source: IOTA/USD on TradingView
IOTA was one of the altcoins to register the sharpest of movements after Bitcoin started breaching resistance levels in late-November. In fact, thanks to the same, IOTA’s value shot up the charts, even briefly overtaking the highs last set in August 2020. While corrections had ensued at press time, IOTA’s price charts still recorded a hike of over 14% over the last 7 days.
The scale of the movement was evidenced by IOTA’s technical indicators as while the Bollinger Bands were expanding to make room for incoming price volatility, the Awesome Oscillator highlighted mostly bullish momentum in the market.
IOTA recently teamed up with Austra’s Christina Doppler Laboratory to foster research in distributed ledger technologies.
Crypto.com Coin [CRO]
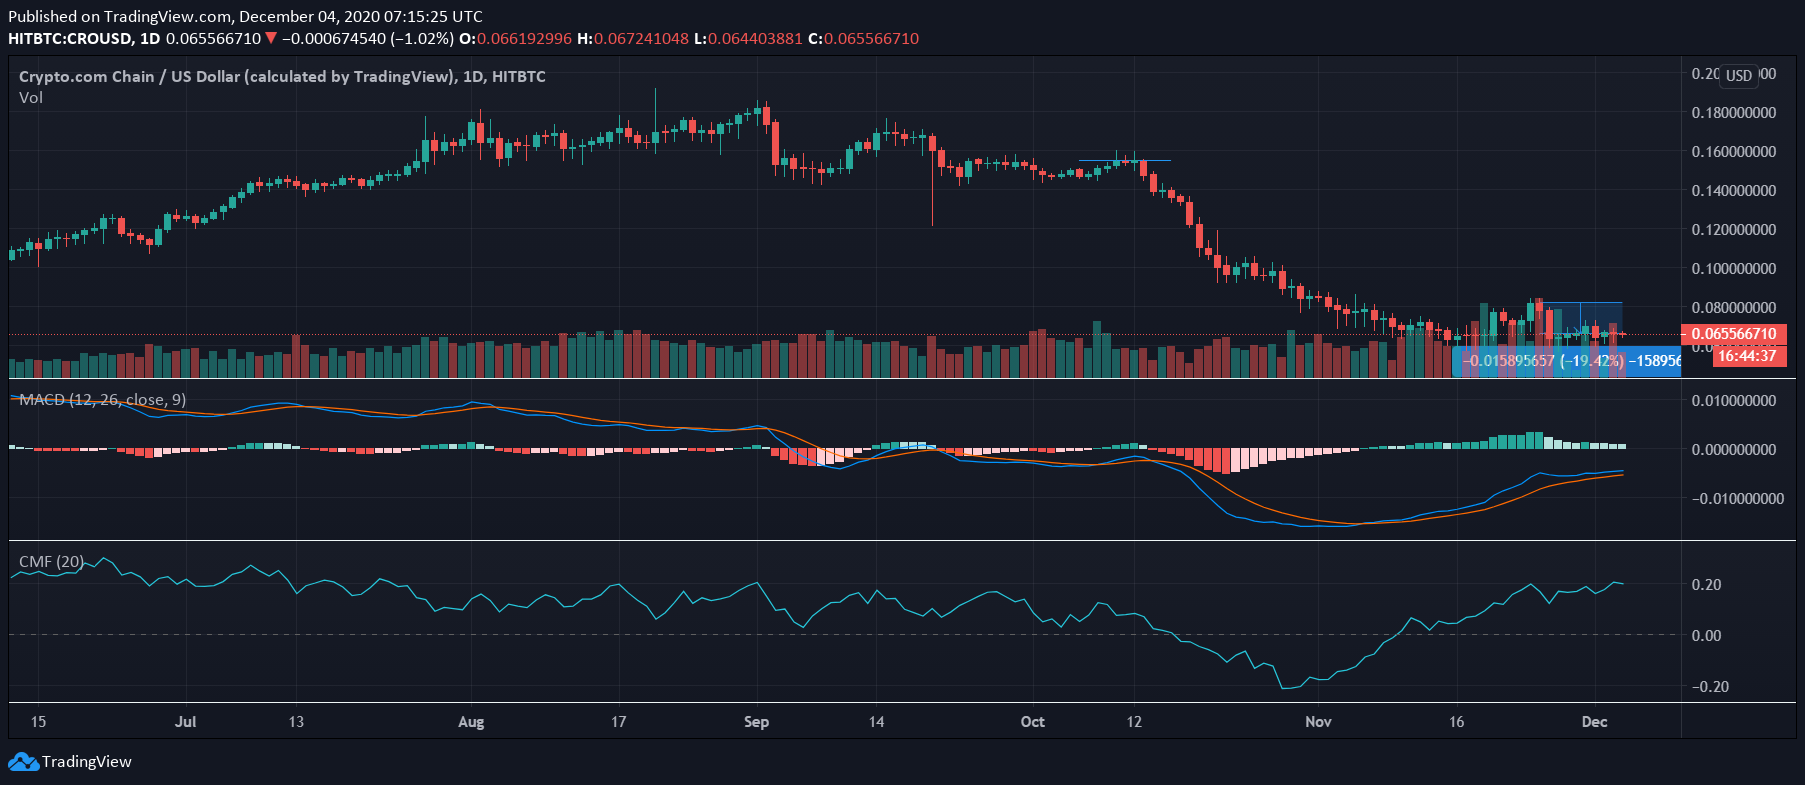
Source: CRO/USD on TradingView
Crypto.com’s CRO has had quite a dramatic year. Having climbed and consolidated on the charts until the end of September, October saw CRO fall steeply down a cliff with the scale of its depreciation taking many by surprise. Oddly enough, CRO’s fall also coincided with the rest of the market’s cryptocurrencies strengthening their positions. What is even more interesting is that Bitcoin’s bearish run as over the past week or so, CRO was still down by almost 20%.
On the contrary, CRO’s indicators still flashed green. While the MACD line was hovering over the Signal line under the histogram, the Chaikin Money Flow was well above zero and near 0.20, a sign of growing capital inflows. At the time of writing, it was difficult to predict whether these indicators’ signals would amount to a trend reversal or not.