Analysis
Stellar Lumens, Polkadot, Status Price Analysis: 07 December
Stellar Lumens was in a phase of consolidation before a breakout from the $0.172-level on the charts. Further down the crypto-ladder, while Polkadot had bearish momentum and could lose the $5-support level to the bears in the coming days, Status formed a descending triangle and expected a breakout over the next few days.
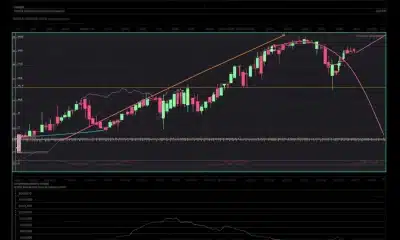
Stellar Lumens [XLM]

Source: XLM/USD on TradingView
XLM had weak bearish momentum behind it and was trading within a descending channel with low trading volume per session. Over the past 24 hours, the price was noted to have straddled the $0.172-level as support.
Trading volume should be a good indicator of the price’s next direction. A candle close above the support and the descending channel backed by noticeably higher volume would point to an XLM move to $0.2 over the coming days.
A close below the support would affirm that the channel is in play, and the price would be forced towards the $0.145-level of support.
Polkadot [DOT]

Source: DOT/USDT on TradingView
Using the Fixed Range Volume Profile for DOT since the start of November, some levels of support and resistance were highlighted. The region at $5.2-$5.3 has seen a good deal of trading activity and can serve as a region of resistance for DOT in the coming days.
The psychological $5-level can also be expected to serve well as support. However, the RSI dropped below the neutral 50-zone and retested it as resistance to indicate that a downtrend was in play.
Hence, it was likely that a session close below $5 would see DOT drop to the $4.8-level of support.
In other news, Huobi Global has taken an active interest in becoming a key player in the growth of the Polkadot network after announcing a Polkadot sponsorship program.
Status [SNT]

Source: SNT/USD on TradingView
SNT formed a descending triangle, and the low trading volume over the past few days alongside the pattern indicated that a breakout was imminent.
This pattern can see a break in either direction, but the charts were leaning north at press time. A strong move backed by good trading volume outside the pattern will affirm the direction of breakout, and a breakout target would be $0.015 in the direction of the move.
Further, the MACD line was hovering above the Signal line on the charts.