Stellar Lumens forming a bearish double-top in the short-term, but bullish respite may be on the horizon

The cryptocurrency market saw most altcoins surging over the past 24 hours. However, that momentum did not last long as the market correction neutralized a majority of these gains, except for Stellar lumens’ (XLM). XLM is currently the only top coin in the green, making a 15.31% climb on the 24-hour price chart.
1-hour chart
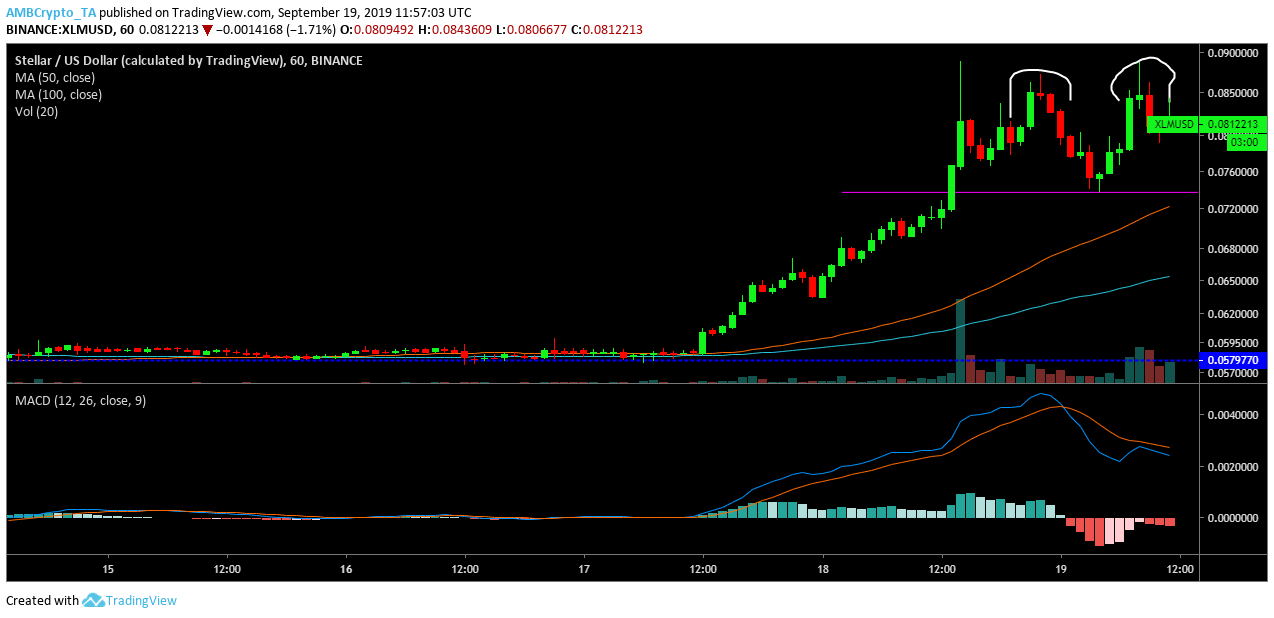
Source: TradingView
If we look at the one-hour price chart for XLM, the momentum seems volatile after the coin reached $0.087 after a massive breakout on 17 September. XLM price broke out from the $0.0585 mark, rose to $0.0872, then again fell to $0.0738 and rose again to $0.0886. XLM is on its way to form a potential double top. If it manages to close below the neckline at $0.073, it would be considered bearish.
Looking at the moving average, the 50-day moving average crosses the 100-day moving average, suggesting bearish momentum. The MACD line crosses over the signal line, also indicating a bearish momentum. However, the MACD line might cross over the signal line in the near future, with the volume also increasing along with the increasing price, suggesting that the 1-hour chart is bullish.
1-Day Chart
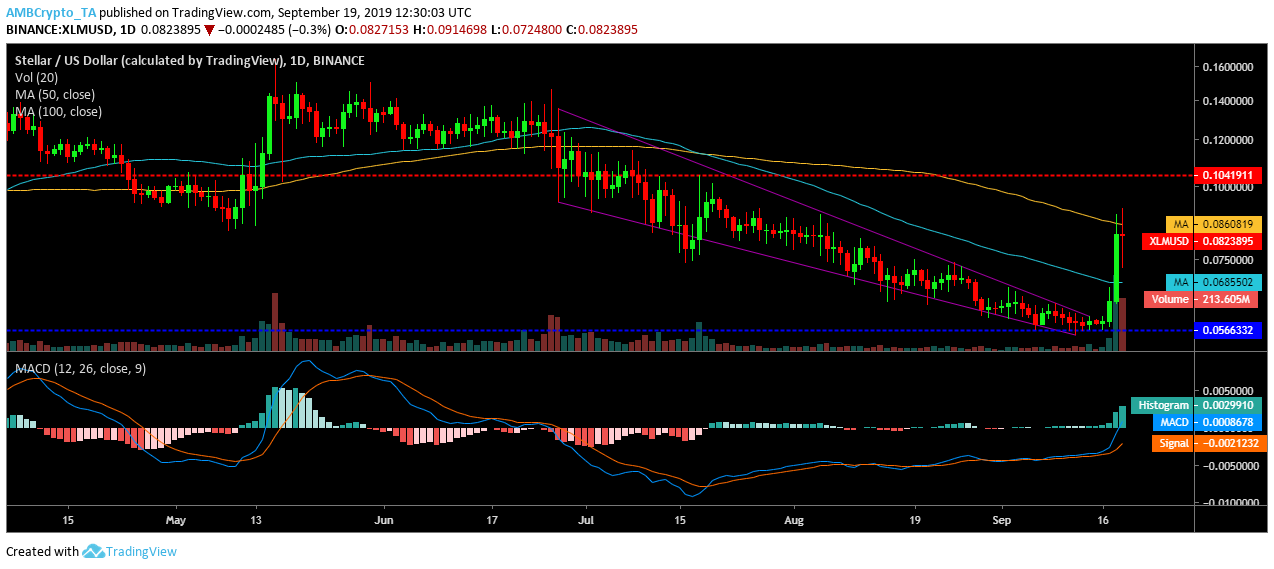
Source: TradingView
On the 1-day chart, XLM is forming a descending wedge which is characterized by two descending lines; the upper trend line bridged lower highs at $0.0744, $0.0728 and $0.0639. On the other hand, the lower trend line bridged lower lows starting at $0.0927, $0.0859 and $0.0700. The descending wedge broke out upwards at $0.059, suggesting bullish momentum.
The 50-day moving average is under the 100-day moving average, suggesting bearish momentum. The MACD line broke above the signal line, indicating bullish momentum. The volume of XLM is also on the rise, along with the price suggesting building bullish momentum.
Conclusion
XLM’s one-hour price chart shows an overall bullish momentum, if the token manages to avoid forming a double top, while on the one day price chart, the bullish momentum looks to continue after the breakout from the descending wedge.