Analysis
Polkadot long-term Price Analysis: 26 November
Disclaimer: The findings of the following article are the sole opinion of the writer and should not be taken as investment advice
Following the lead of Bitcoin, the world’s largest cryptocurrency, most altcoins have also noted price breakdowns on their charts. Polkadot, one of the industry’s major altcoins, also saw its value crumble under the market’s bearish pressure. While some are already speculating that the ‘alt season is dead,’ DOT was attempting to initiate a rally on its charts, at the time of writing.
Polkadot 4-hour chart
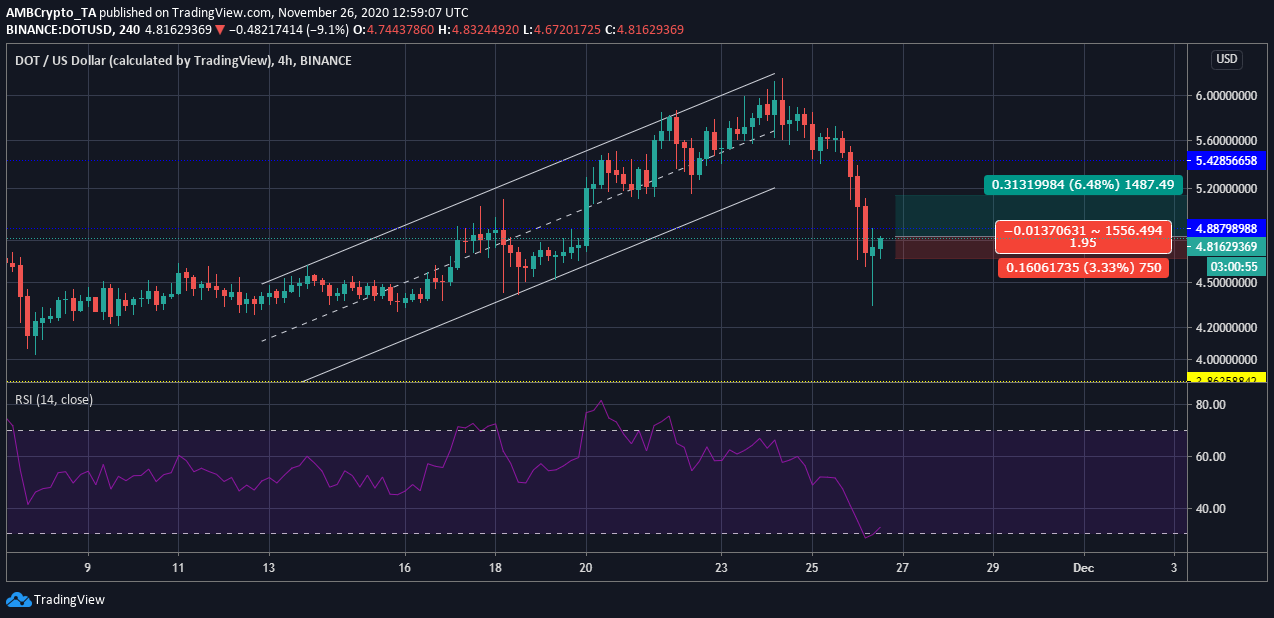
Source: DOT/USD on TradingView
Polkadot’s 4-hour chart highlighted the breach of the long-term ascending channel. While the value of DOT marked an all-time high at $6.15, it fell soon after. The sudden price drop caused the price to sink to $4.34, but DOT managed to push its way up. At press time, DOT was being traded at $4.77, having tested the resistance at $4.88 twice.
However, the buying pressure in the market was rising and this could help the traders in making a profit with a long position.
Reasoning
The push and pull have continued from the traders’ end, but the cryptocurrency has reached an oversold point.
This was underlined by the Relative Strength Index as it dipped into the oversold zone, before bouncing back. The buyers could be seen pushing the price of DOT higher, and since the coin was still moving along the oversold zone, there could be a sharp push. The support at $4.611 has managed to maintain the cryptocurrency’s price high.
Positions
Entry for a Long position:$4.83
Take Profit: $5.14
Stop Loss: $4.66
Risk/Reward Ratio: 1.95
Conclusion
Although the profit margin wasn’t huge, the loss could be amended by the small profits in the market. As DOT’s price moves to achieve equilibrium, there could be an opportunity for the traders to long the altcoin.