Analysis
Polkadot, EOS, Dogecoin Price Analysis: 23 September
Polkadot had shown a bullish divergence recently and saw a minor rise in its price, but bears were likely to win the battle in the coming days. EOS faced a crucial level of support and failure to defend it would be pretty bad news for bulls. Dogecoin on the other hand did not slow down its bearish trend and continued to slump.
Polkadot [DOT]
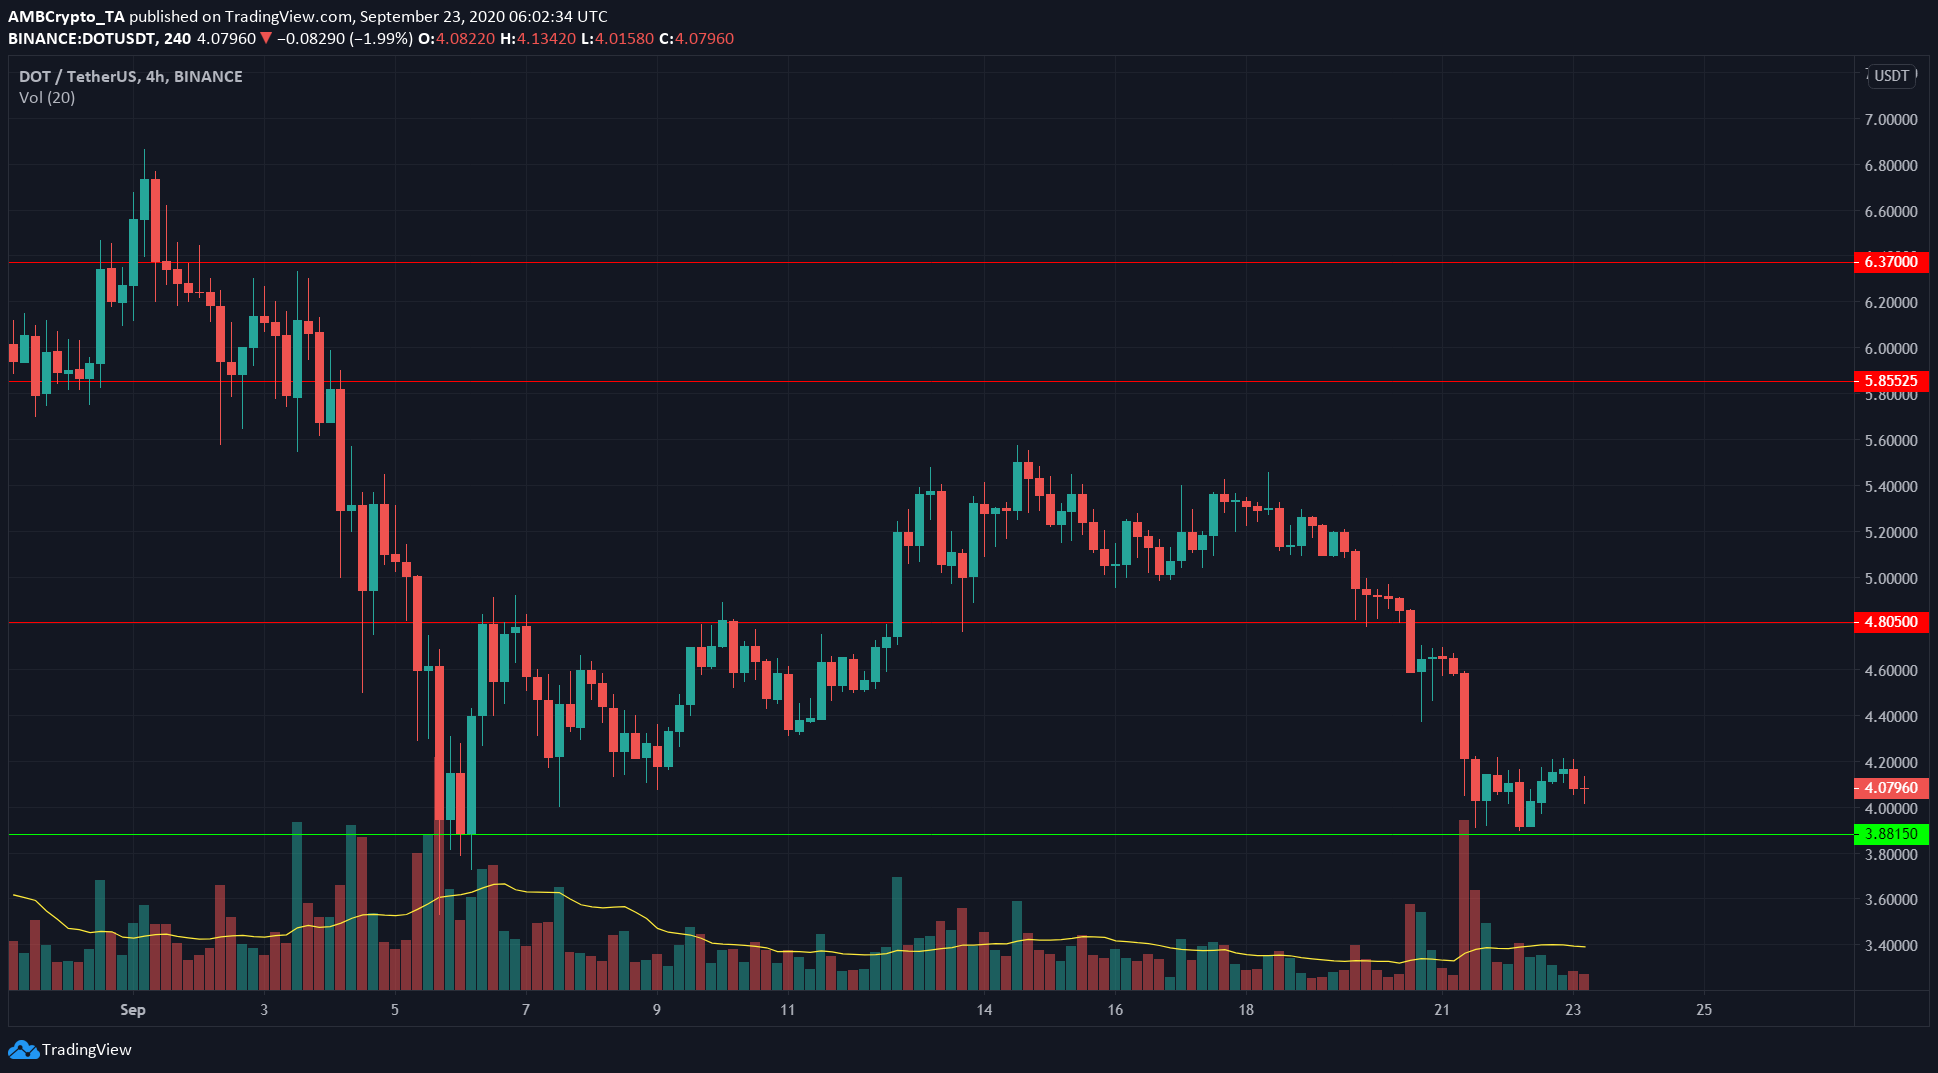
source: DOT/USDT on TradingView
DOT bounced off support in the $3.9 region and rose to $4.2. This move occurred on low trading volume and proved to be a bounce in a downtrend.
With DOT likely to test support once more, it is crucial for bulls to defend support. If bears prevail, they could drive the price to the next level of support at $3.
How DOT reacts at the support level would indicate the next direction. A break to the south on above-average trading volume would suggest $3 is the next target, while a move to the upside on good volume would indicate the possibility of $4.8 being tested once more.
In other news, it was reported that digital asset development company RockX has launched a $20 million investment program to support the Polkadot ecosystem.
EOS
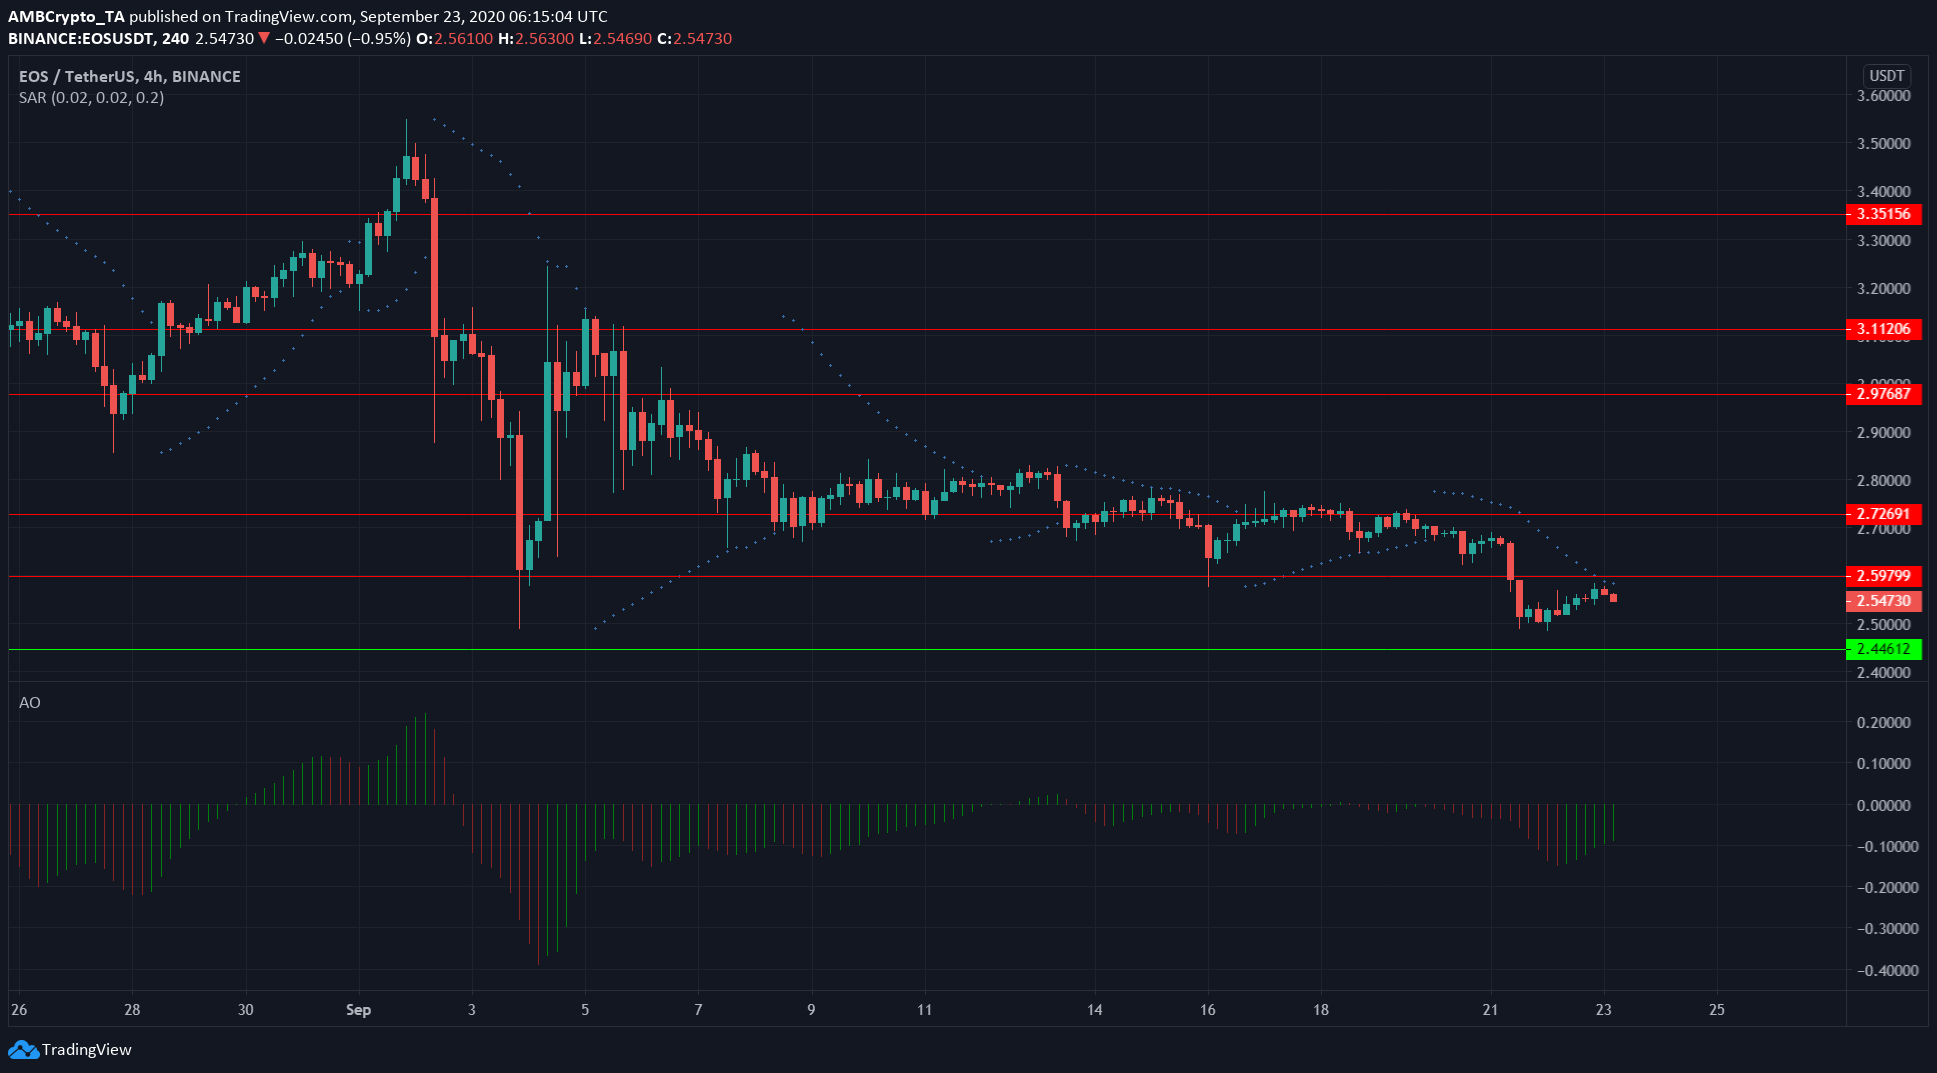
Source: EOS/USDT on TradingView
In the short-term, EOS was set to test support at $2.44. RSI showed a bearish momentum with a value of 35 and has been dropping in recent trading sessions. Even when it moved into oversold conditions, the price was only able to gain 2.72%, showing the feebleness of bulls.
Parabolic SAR also gave a sell signal and showed that EOS is likely headed toward $2.38 in the coming trading sessions.
On a longer time-frame, EOS is likely to bottom in the $2.33-2.38 region and see a surge upward. However, if EOS descended past this level and stayed there for multiple days, it could see a lot more losses.
Dogecoin [DOGE]
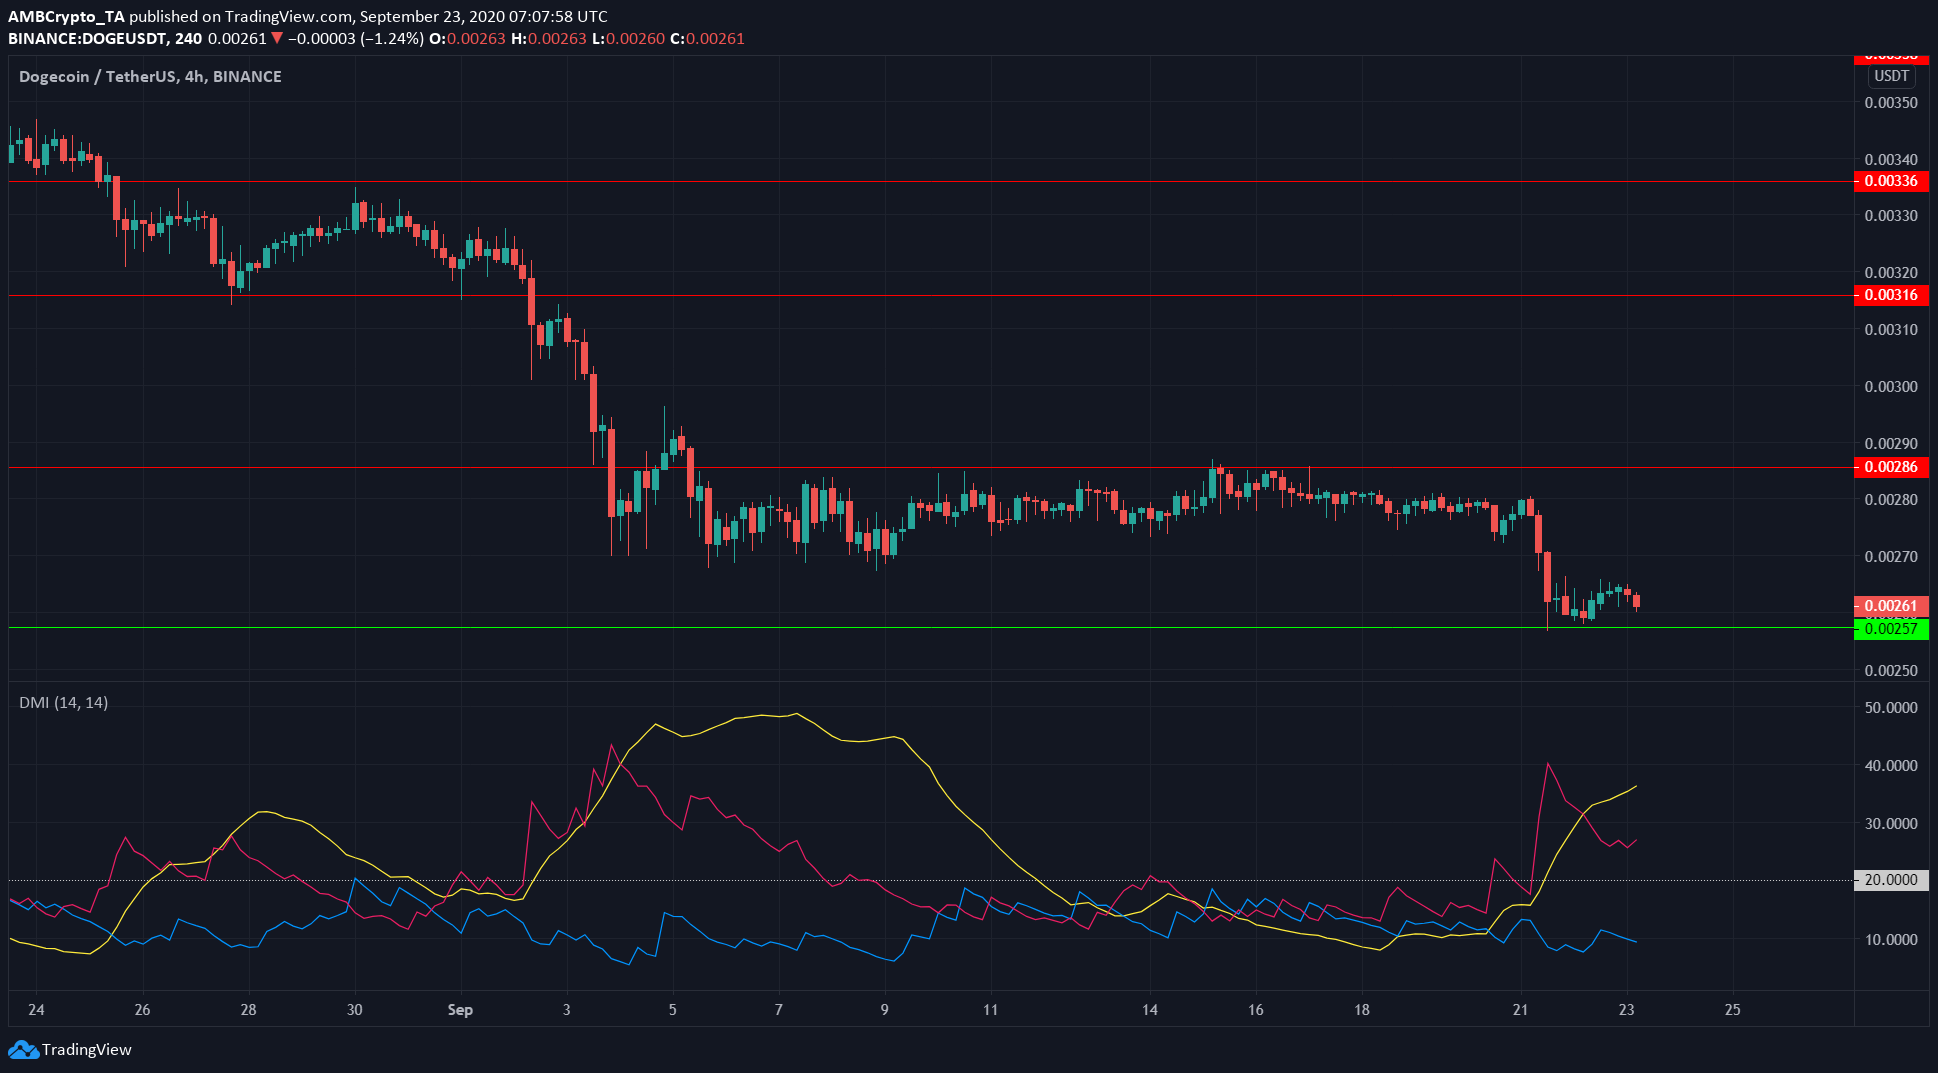
Source: DOGE/USDT on TradingView
Dogecoin continued to show bearishness on the charts. DOGE tested support at $0.0025and bounced to $0.00267. At press time, it was facing another wave of selling pressure.
DMI showed a strengthening bearish trend as ADX (yellow) showed a value of 36 and has been rising. This shows a very strong trend. The -DMI (pink) line has stayed above +DMI (blue) to indicate the bearish bias of the trend.