Volume-wise, most Polkadot traders were betting heavily on an uptrend, as the DOT market stayed bullish on the daily charts. DASH and Dogecoin on the other hand behaved conversely, depicting bearish scenarios.
Reversing its previous trend, immediate bearish momentum was noted in DASH. While Dogecoin continued to remain bearish for the last 48 hours, with mounting selling pressure visible for the DOGE market.
Polkadot [DOT]
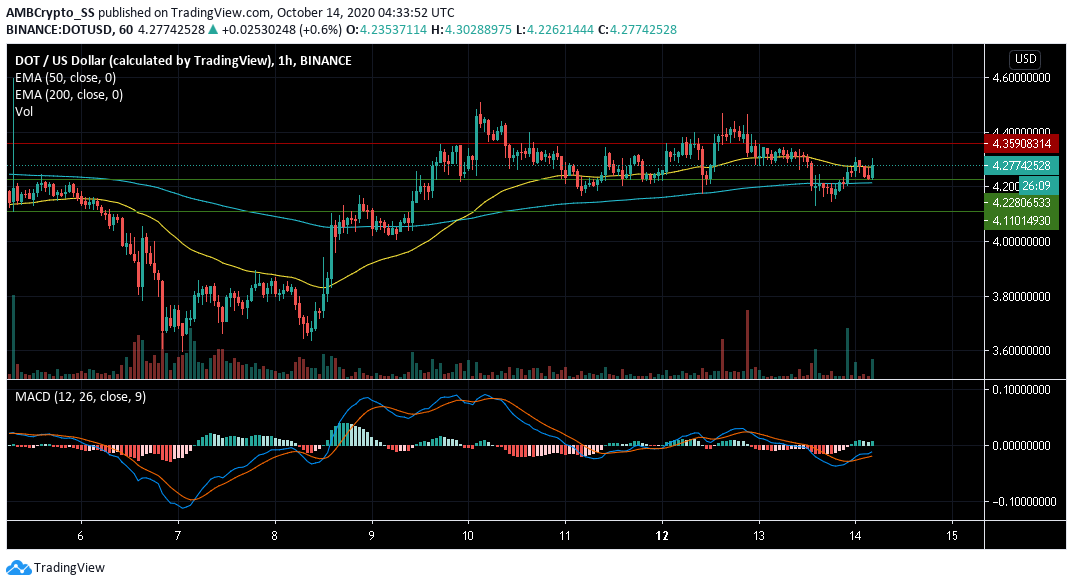
Source: DOT/USD on TradingView
Polkadot was experiencing some selling pressure on its daily charts today. Despite losing around 2% since yesterday, a decline in its buying pressure was still not visible.
This meant that the bulls continued to remain strong, and the same was witnessed at press time. Above-average buying volumes pushed the digital asset back up, above its immediate support at $ 4.228
The bullishness depicted in MACD which underlined the positive buying momentum in the DOT market. The price further continued to stay above its 200-period moving average, with the 50 SMA above the 200 SMA, another sign of a positive price trend to continue for the short term.
In other news, popular exchange KuCoin recently launched the USDT-Margined Polkadot (DOT), supporting 1-50x leverage.
DASH
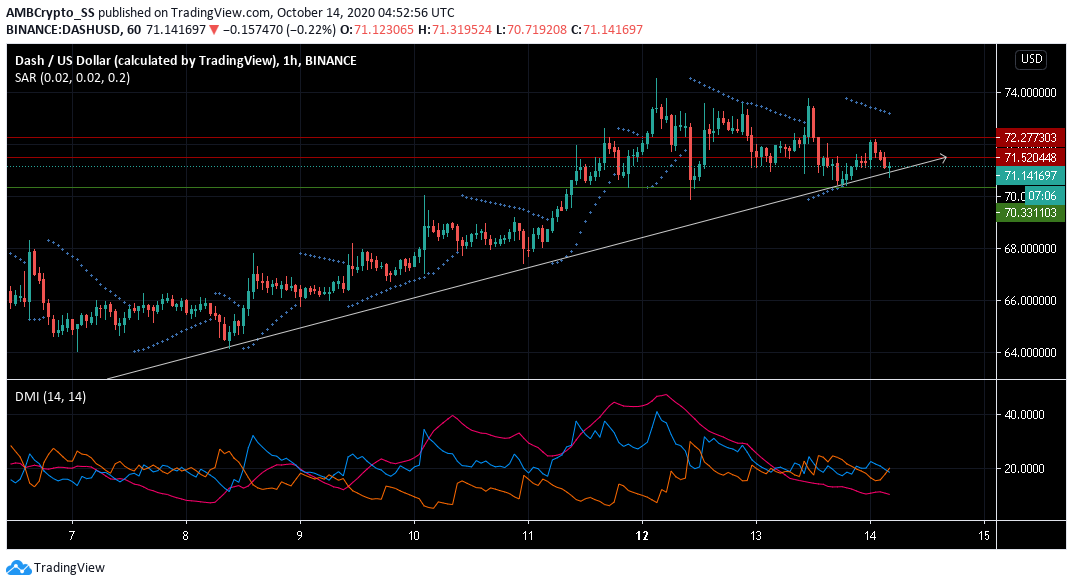
Source: DASH/USD on TradingView
DASH at press time was seen hovering at the $ 71.141 level. Witnessing a price dump, by almost 1.37% since yesterday, the 1-hour chart for the digital asset was bearish.
The Directional Movement Index, with its +DMI (blue) crossing below the -DMI(orange) hinted towards a bearish setup. However, a falling ADX suggested weakness in the selling pressure.
Further, the dotted lines of the Parabolic SAR above the candles also suggesting a downtrend.
If DASH fails to stabilize just above the key support level at $70.33, the position of the bears may further get strengthened, confirming the downtrend over the next few trading sessions.
Dogecoin [DOGE]
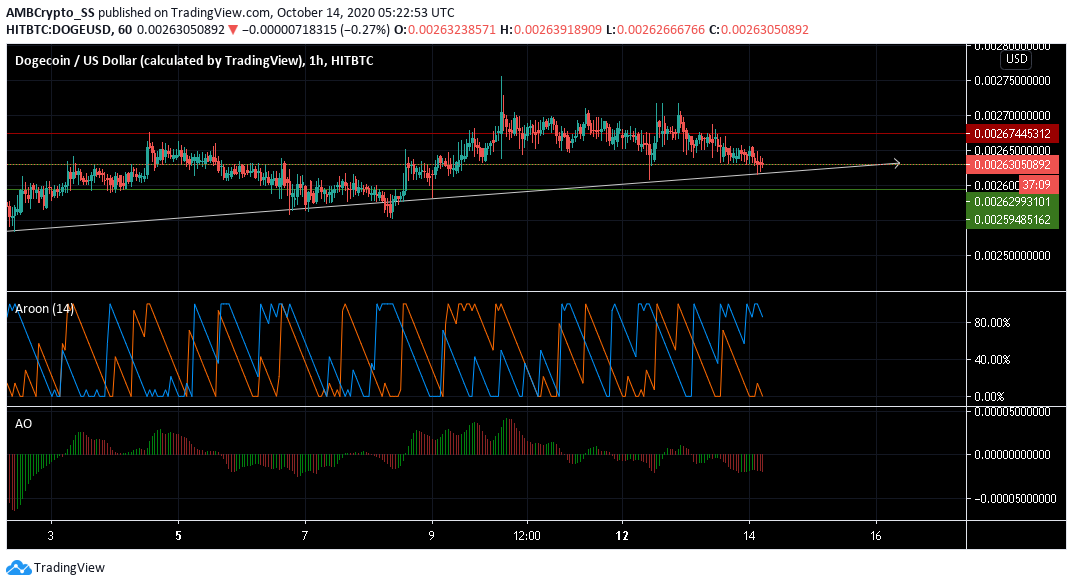
Source: DOGE/USD on TradingView
Dogecoin displayed a downwards momentum following a dip over the last 48 hrs. The digital asset at press time traded at $ 0.00263
The Awesome oscillator was displaying red closing bars below the zero line, indicating bearishness both in the short- and long-term price trends for Dogecoin.
Confirming the trend of mounting selling pressure, the Aroon Indicator too was bearish, as the Aroon Down (blue) was above the Aroon Up (Orange).
This meant with the DOGE market falling below its immediate support at $ 0.00262, another downtrend below the trendline may also follow.