Ontology, STEEM, XRP Price Analysis: 25 September

The last 48 hours came as a respite to many of the market’s altcoins, especially after most were pulled down by Bitcoin’s own depreciation on the charts. Thanks to BTC’s recovery, many of these alts recovered too, with the likes of XRP, STEEM, and Ontology among them. However, whether the recent bullishness is enough to reverse the prevailing downtrend is another matter altogether.
XRP

Source: XRP/USD on TradingView
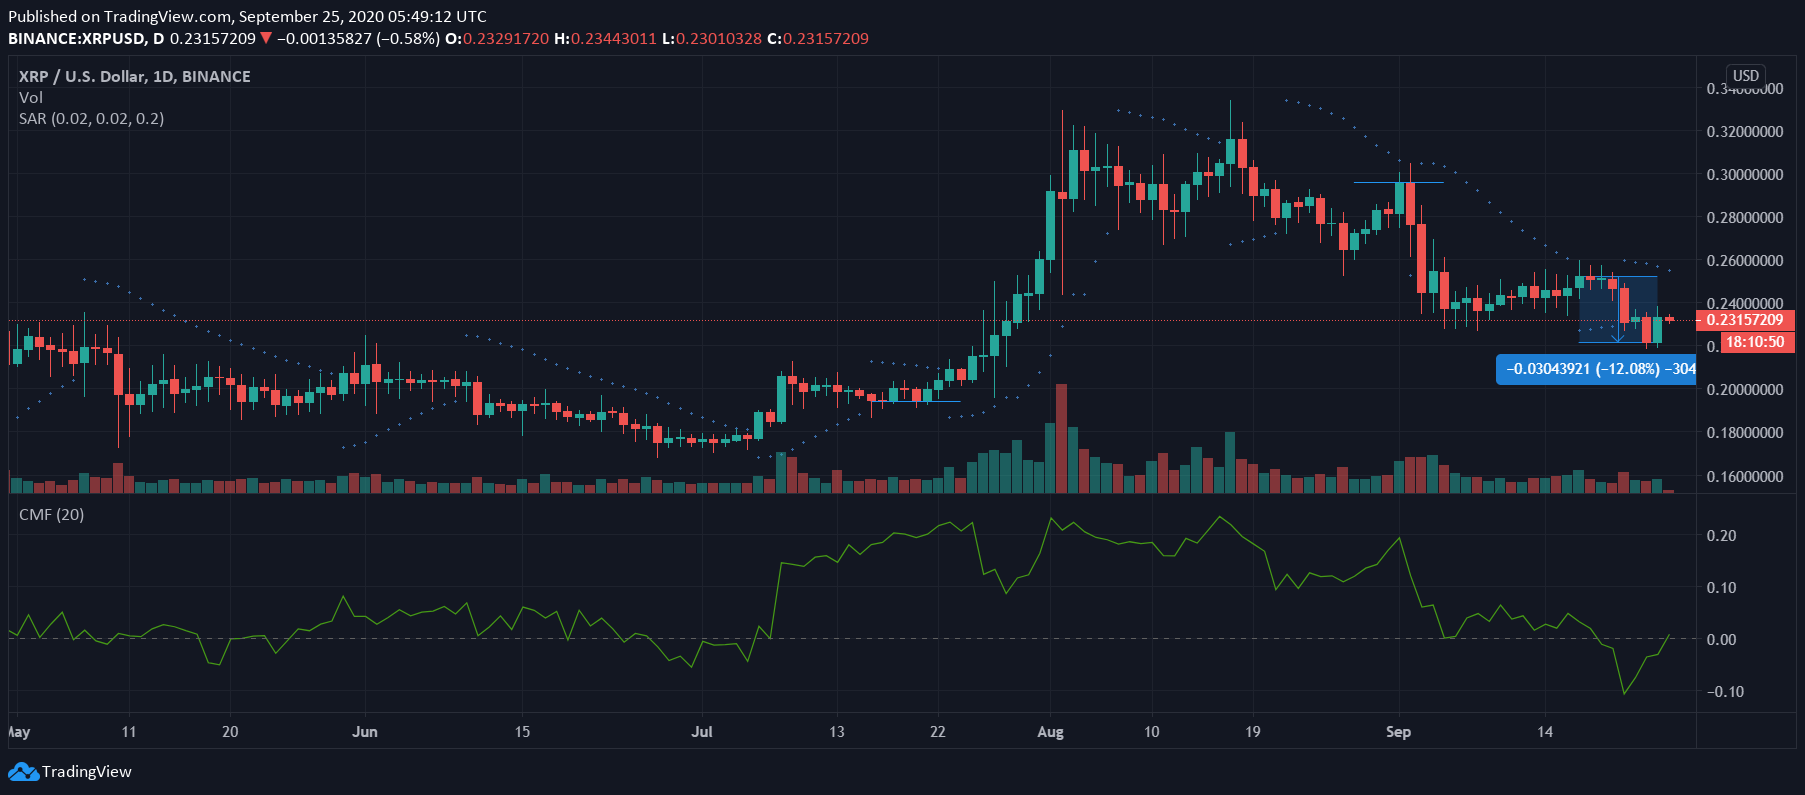
XRP, formerly the third-largest cryptocurrency by market cap, has enjoyed a topsy-turvy 2020. While late-July and the month of August saw XRP climb to yearly highs, the period before it and after, haven’t been so kind. In fact, since the market-wide depreciation on the 2nd of September, the cryptocurrency’s value has dipped substantially. This was only made worse by Bitcoin falling to $10,100 a few days ago after having failed to breach its resistance levels.
At the time of writing, however, BTC’s performance was giving some impetus to XRP’s recovery, with the crypto trying to reverse its 12% losses.
XRP’s technical indicators, however, gave mixed signals. While the Parabolic SAR’s dotted markers were well above the price candles, the Chaikin Money Flow registered a sharp spike on the charts, pushing the CMF above 1, a sign of growing capital inflows. In light of these mixed indicators, it is difficult to say whether a sustained trend reversal is incoming.
XRP was in the news after the launch of Kava Labs’ Harvest.io, an automated money market protocol that is designed to support assets well beyond Ethereum to include Bitcoin and XRP.
Ontology [ONT]

Source: ONT/USD on TradingView
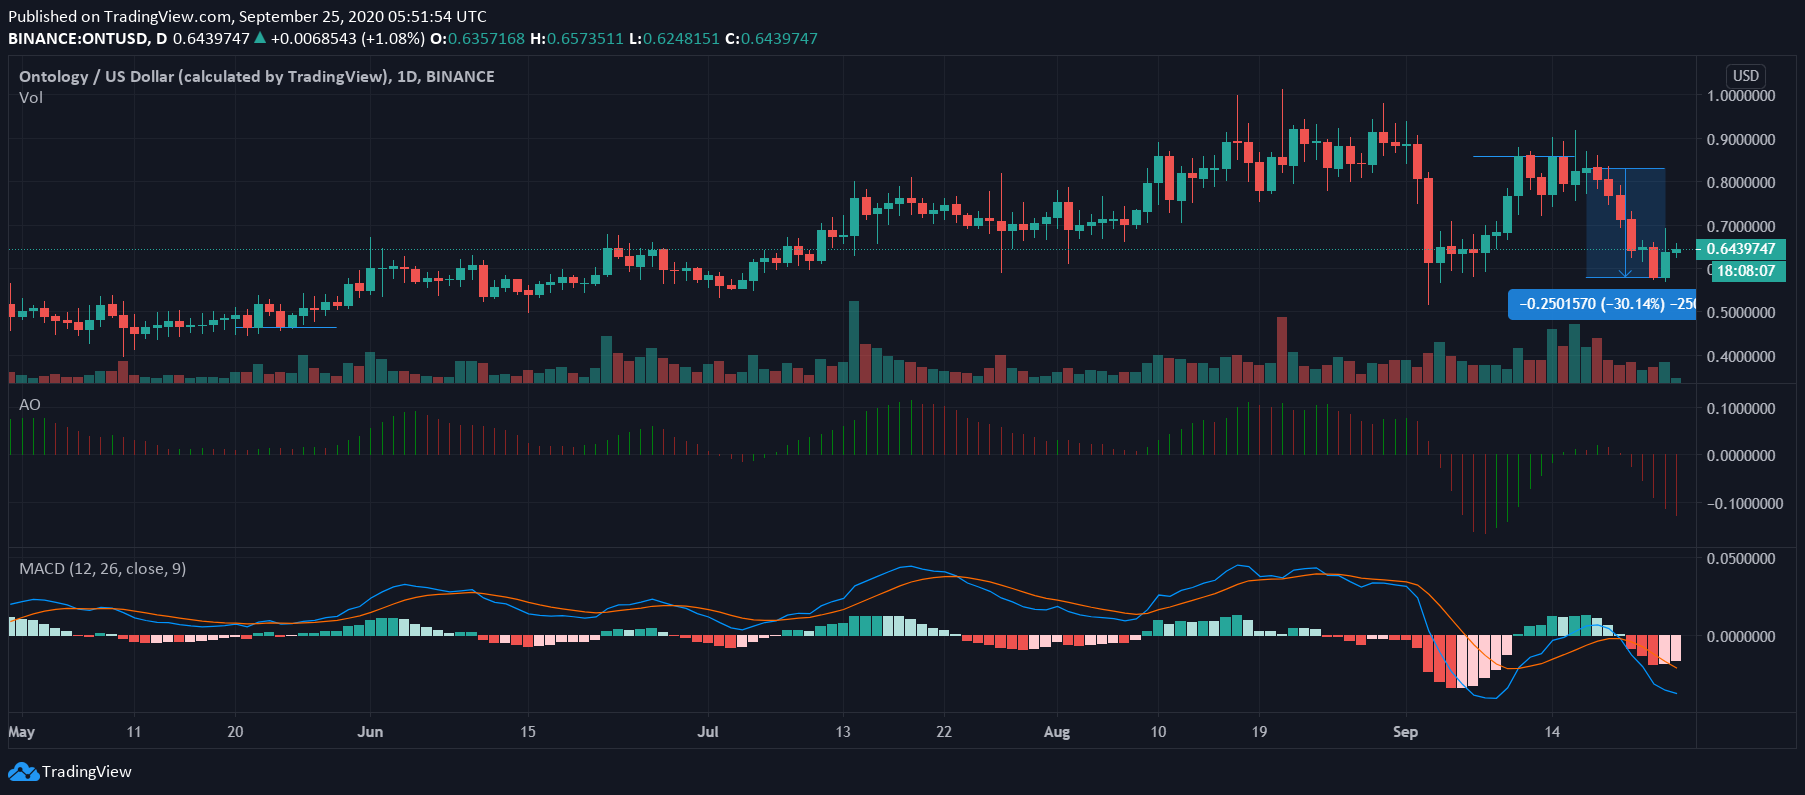
ONT, the market’s 38th-ranked cryptocurrency, saw its early-September gains wiped out over the past week. This was an interesting development since over the aforementioned period, the larger market had noted a bloodbath of sorts, with cryptos falling on the charts left, right, and center. Thanks to the most recent market devaluation, ONT, again, was trading at its late-August price levels. It must be noted, however, that the last 7 days saw ONT’s trading volume fall significantly.
In fact, despite the fact that the last two price candles were green, ONT was still down by over 25% on the charts.
The sheer scale of the fall was highlighted bt the cryptocurrency’s technical indicators as while the Awesome Oscillator pictured falling bearish momentum, the MACD line was well below the Signal line on the charts.
STEEM

Source: STEEM/USD on TradingView
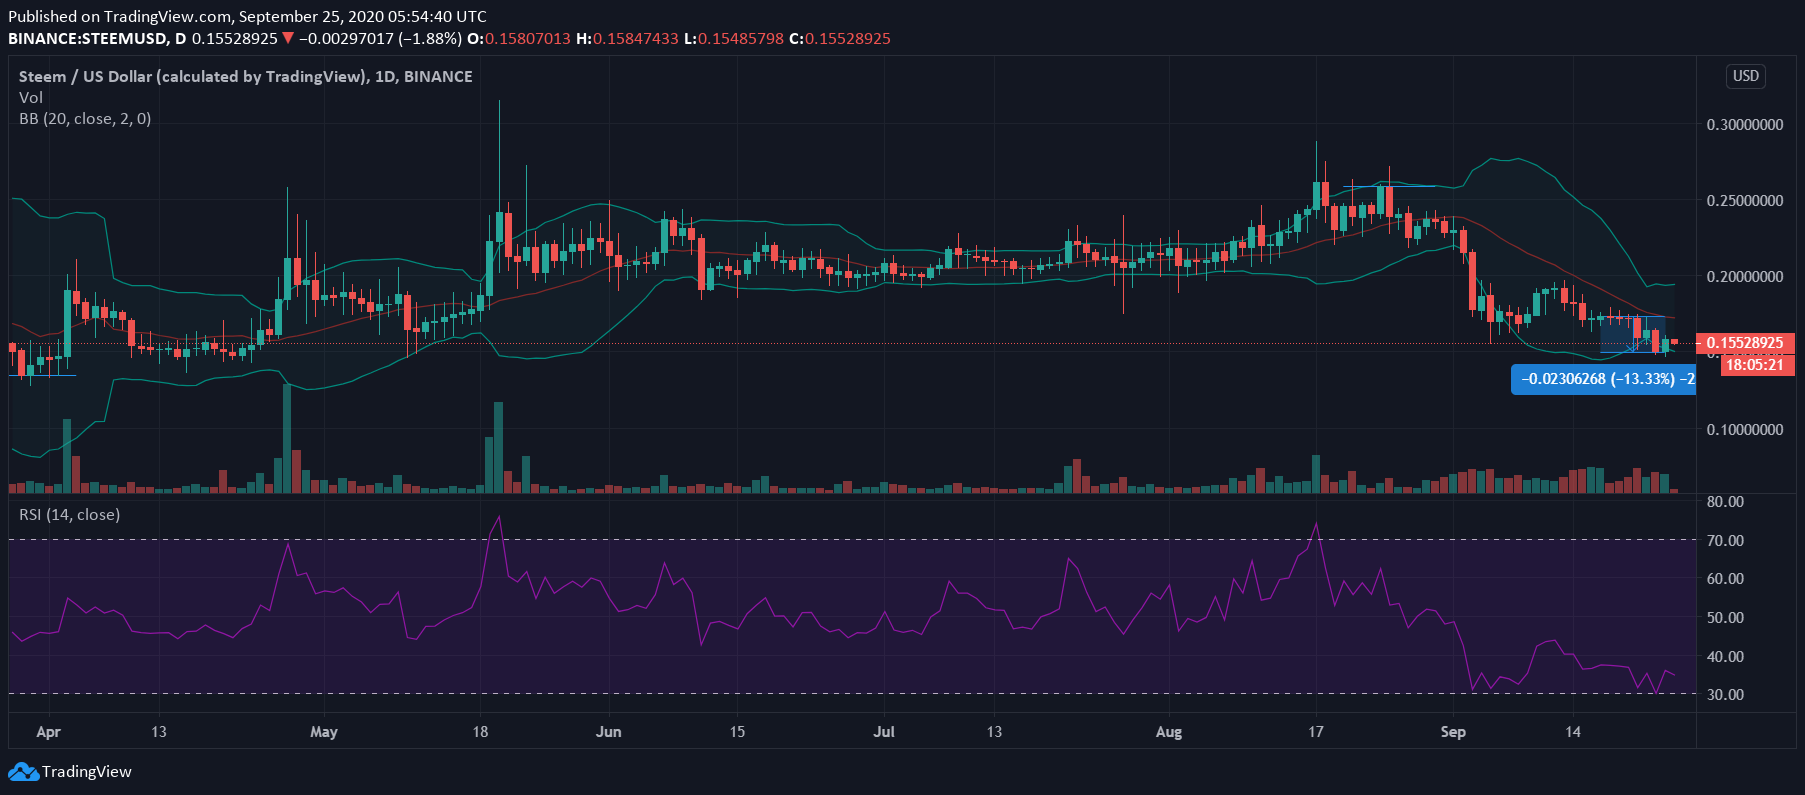
Following an acrimonious few months, STEEM seemed to be on its way towards posting some significant gains on the charts, with the crypto registering a local top in mid-August. However, this wasn’t to last, with STEEM soon noting a sharp downtrend on the charts. Bitcoin’s fall on the 2nd of September, and the one that followed, both pulled down the crypto’s price even lower on the charts. In fact, over the past week, STEEM was down by over 13%.
However, the mouth of the Bollinger Bands seemed to be holding uniformly, a sign of steady price volatility in the market. Further, the Relative Strength Index was very close to the oversold zone, an indication of how precarious the crypto’s market position is.
