Litecoin’s rectangle bottom pattern suggests positive price breakout

Since reaching its yearly high in June and peaking $146, Litecoin has been on a downwards trend. Currently, it is consolidating around the $58 mark. With a daily trading volume of $2.3 billion and a market cap of $3.6 billion, Litecoin is ranked 6th on CoinMarketCap, recording a 0.62% increase in value over the last 24 hours.
Litecoin hourly chart

Source: LTC/USD on TradingView
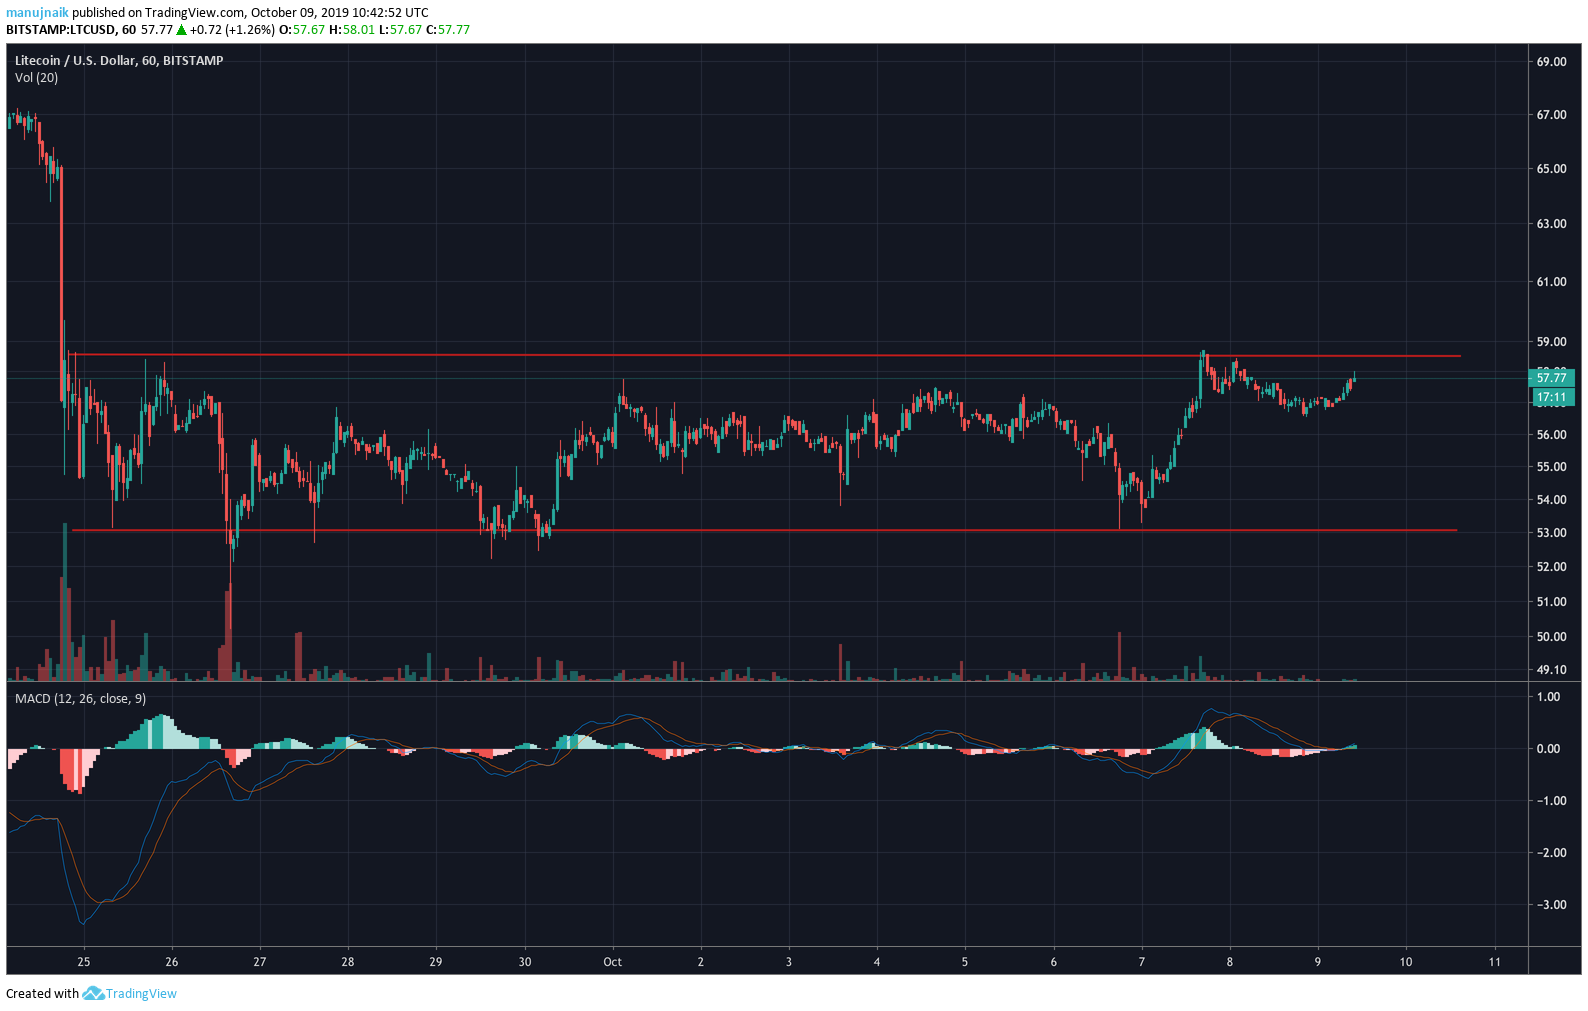
The 1-hour chart for the coin shows that LTC entered a rectangle bottom pattern after the price drop on 24 August. Since then, it has oscillated between the $58 and $53 mark, with the possibility of an imminent price breakout upwards.
Rectangle bottoms can be recognized by two horizontal parallel lines encompassing the price trend and touching at 5 points. The decreasing volumes over the period further supports this theory.
The MACD line crossing over the signal line is also an indicator of a bullish crossover for Litecoin.
4-hour chart

Source: LTC/USD on TradingView
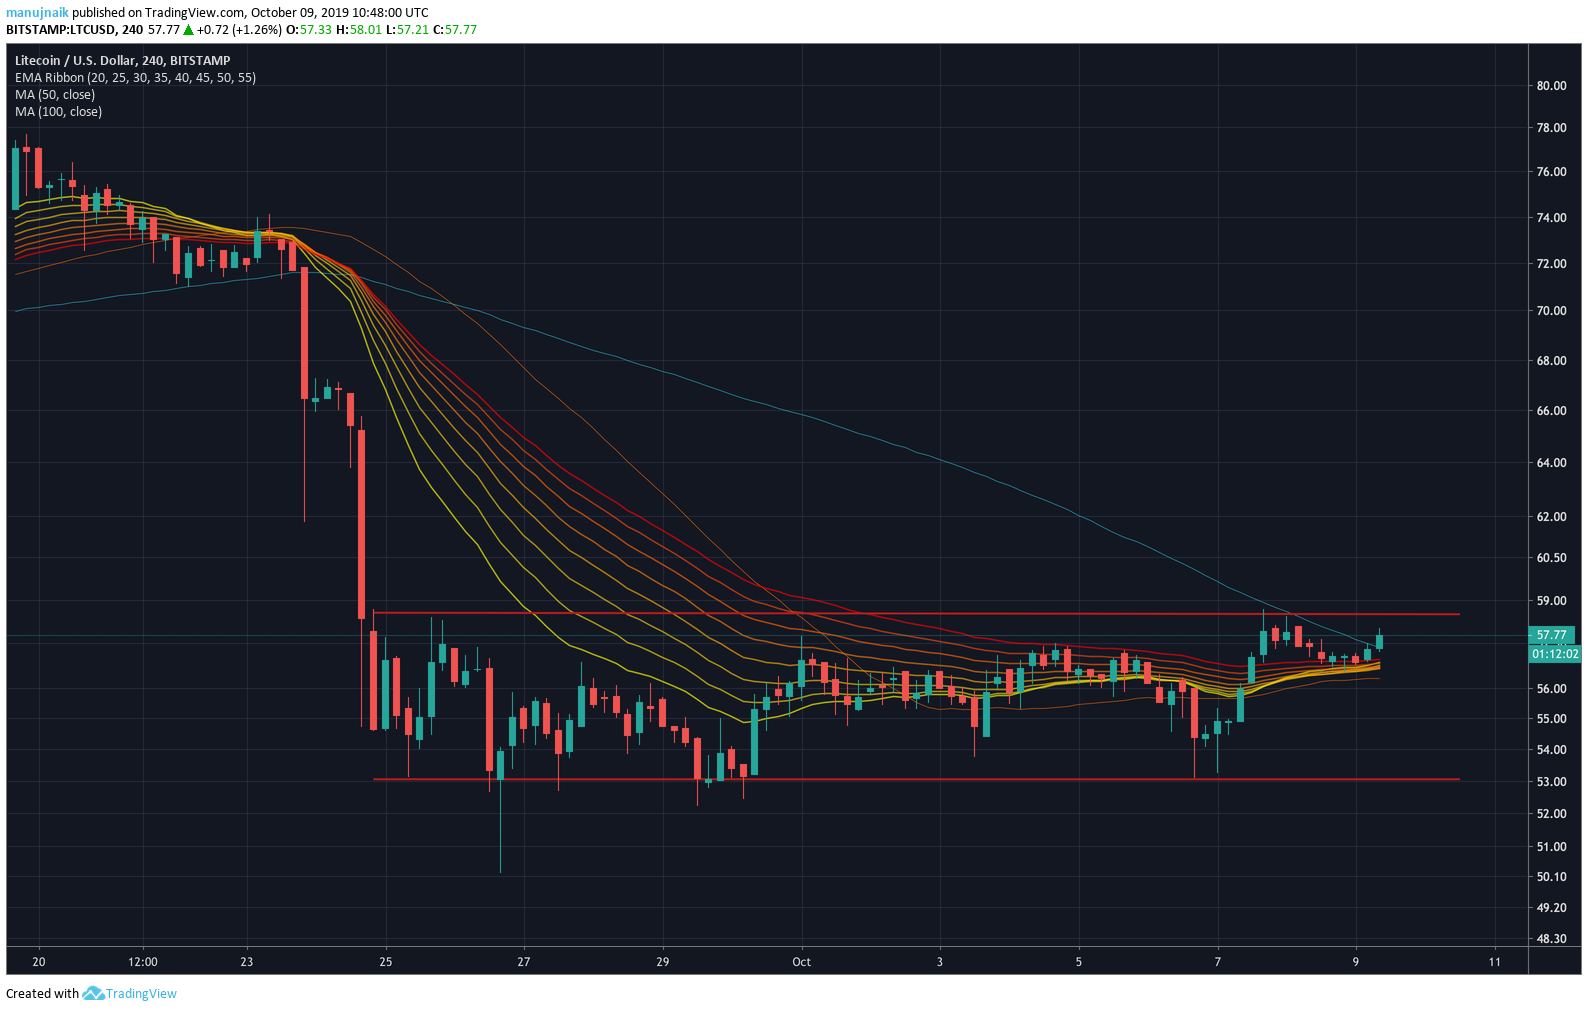
The 4-hour chart for Litecoin shows a better representation of the rectangle bottom pattern.
It can be seen that the EMA Ribbon lines are moving under the LTC price trend and preparing to diverge. Another indicator of a bullish short-term future for the coin is the 50-day moving average being under the price trend. The chart also shows that the latest candle closed above the 100-day moving average, which means that an upwards price breakout could be imminent.
With rectangle bottom patterns breaking out upwards almost 60% of the time, it is likely that Litecoin’s price trend will move up towards the $63 mark soon.


