Analysis
Litecoin’s prices could be heading for a positive breakout in the long term
Litecoin bulls continued to hover below its previously strong support zone around the $70 mark, despite subtle signs of recovery. After undergoing major losses in August this year, Litecoin, the fifth-largest cryptocurrency by market cap, might be heading for an upward breakout.
At press time, Litecoin held a market cap of $4.14 billion and a 24-hour trading volume of $2.55 billion. And, as the LTC market continued to be at the end of rejection from the bulls, it was trading at $65.52 after a decline of 3.04% over the last 24 hours, at press time.
However, there are two scenarios that suggest that a bullish phase may be in the future for the coin.
24-hour Chart:


Source: TradingView
The 24-hour chart for Litecoin highlighted a Falling Wedge pattern, which suggested a potential appreciation in Litecoin’s value in the near-term. The 21-day moving average line acted as a support until the latter part of June. However, it now poses as strong resistance, which, if breached, could contribute to a significant rise of 19% in Litecoin’s price. The above chart predicts a possible recovery as the Falling Wedge has been extending for the past 64 days.
The MACD line in the LTC chart was also above the signal line after a bullish crossover, implying an inclination towards the bull.
7-day Chart:

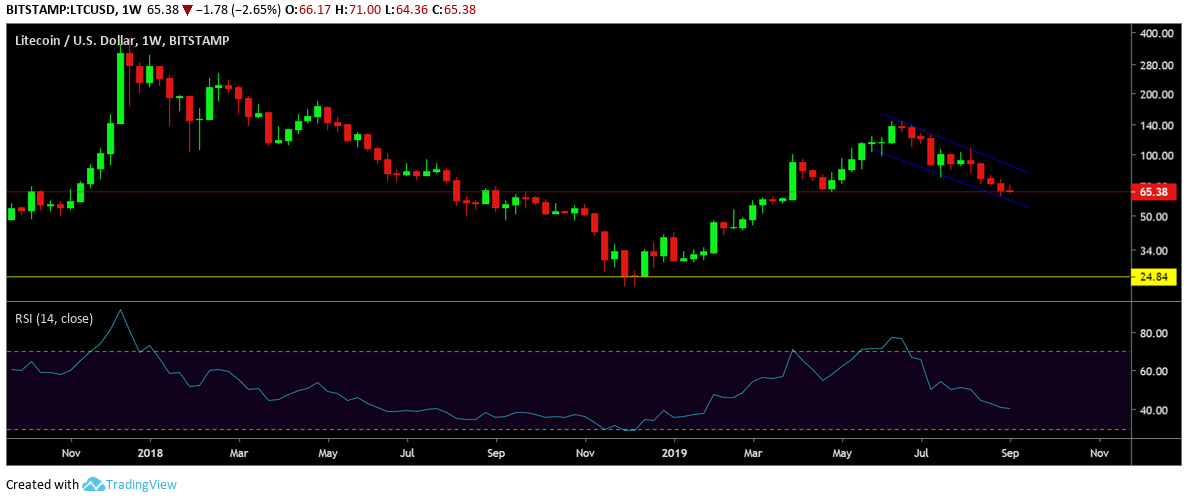
Source: TradingView
A Down Sloping Channel in Litecoin’s weekly chart further exhibited a potential price breakout scenario in the future. Confirming the pattern was the Relative Strength Index indicator which showed that LTC was close to the oversold territory. This further indicated a possible move upwards for the RSI for the 7-day weekly time frame. However, there were still three more days to go for the weekly candle to close.
Conclusion
The odds of Litecoin’s price breaking upwards is considerably higher, despite the fact that the phase continued to be speculative.