Analysis
Litecoin’s make or break situation: 16% surge or retest 2018 lows?

Litecoin, like other altcoins, has experienced a rough patch considering the recent drop in Bitcoin’s price. Owing to its correlation with Bitcoin, Litecoin has dropped by 41% in the last 30 hours or so.
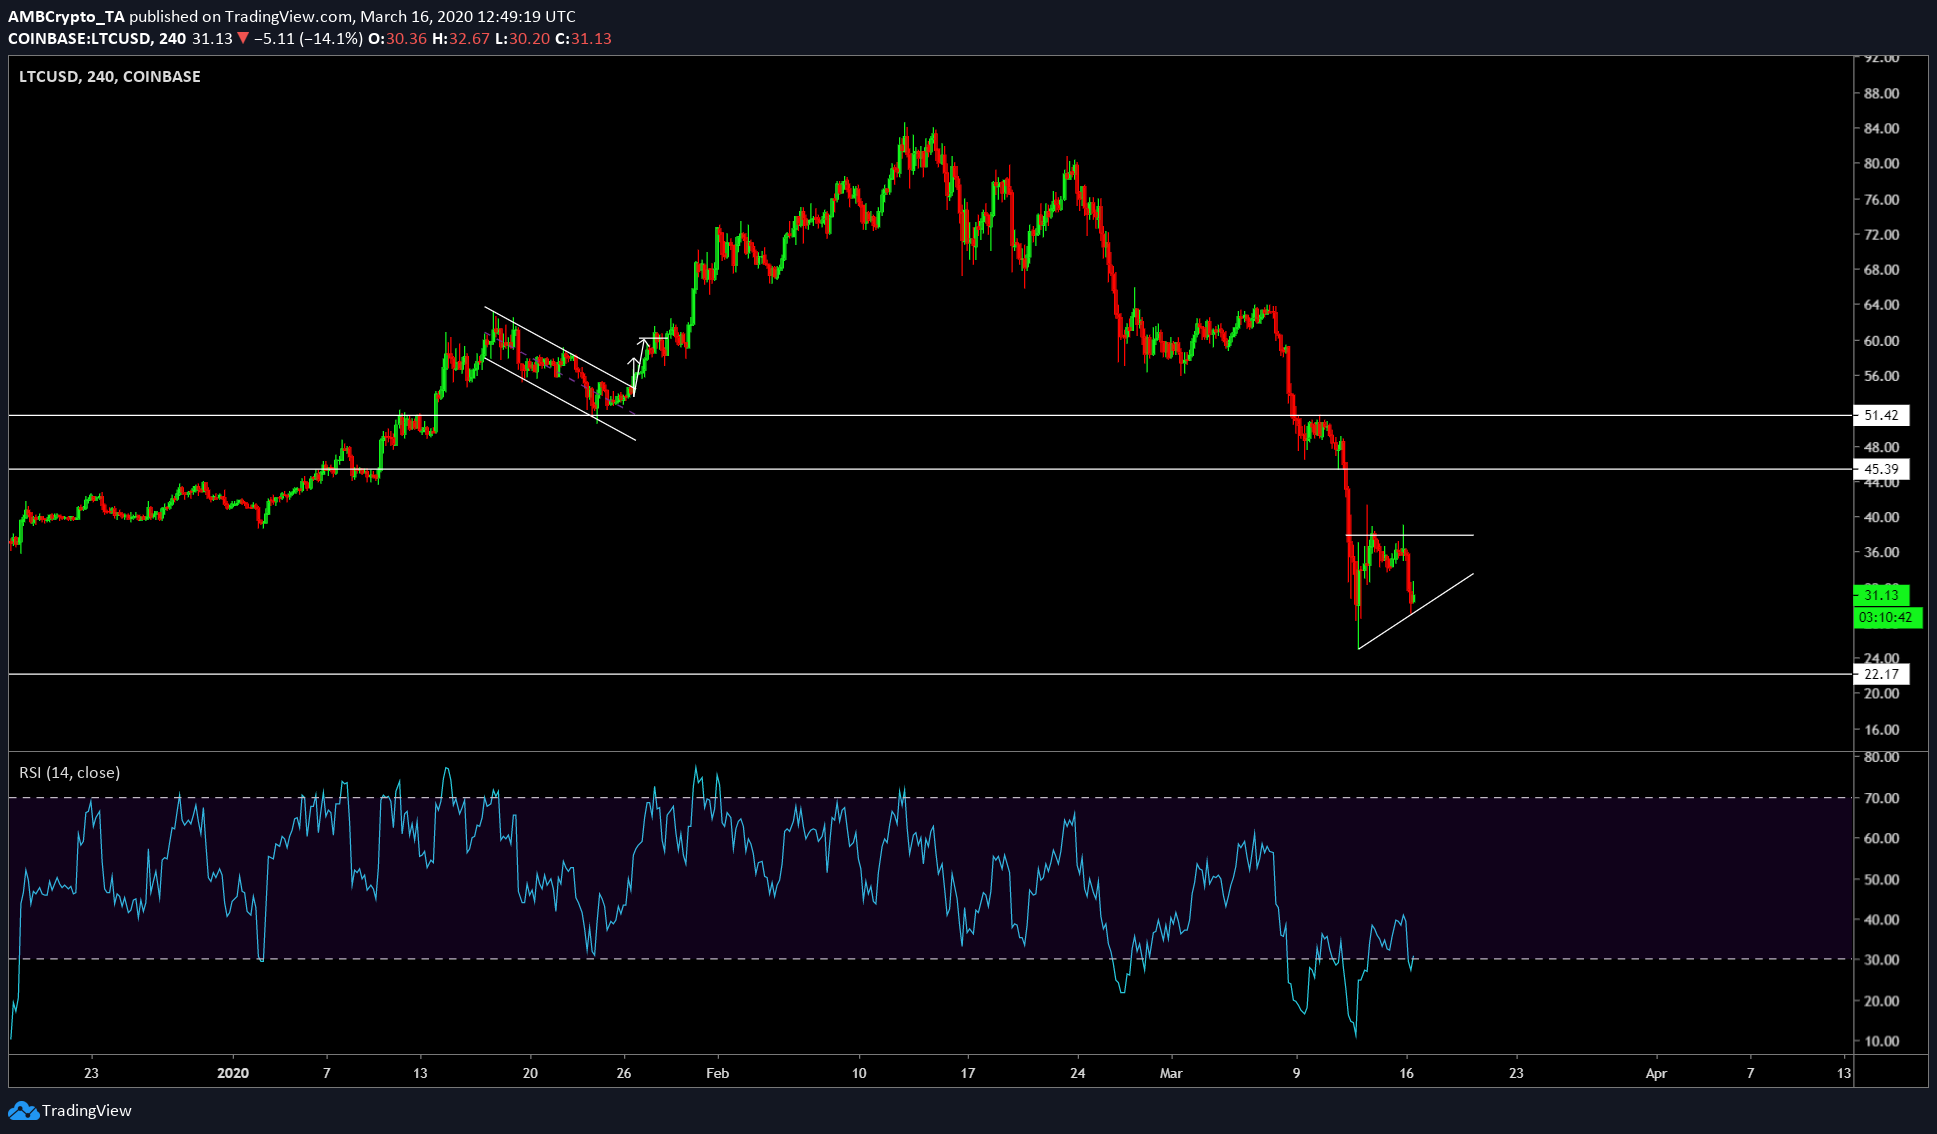
Overall, the price has dropped by 70% since February 13. However, the price seems to be moving sideways at press time. With the price hovering at $31.50, Litecoin formed an ascending triangle, which usually has a bullish break.
Four Hour Chart

Source: LTC/USD TradingView
The four-hour chart for Litecoin showed formation of an ascending triangle with two bottom and top touches. The pattern will be completed in 48 – 72 hours leading to a breakout. Although there is mild bullish bias, there is still a chance for it to breach lower if the overall market dips.
RSI rising higher and above the oversold zone lends support to the bullish bias scenario. Hence, a further rise would push the price to the upper line of the triangle, which is 16% away from its current price of $31.50.
Further bullish pressure and breakout will cause the price to hit resistance at $45.39 and $51.42. However, as mentioned above, if there is a bearish breakout, the price will dip directly to its previous bottom at $22, which would be a 30% drop from the current price.
Correlation and Returns
Source: Coinmetrics
Litecoin’s correlation with Bitcoin has skyrocketed in the last 30 days and the 180-day correlation has hit 0.8604, a new yearly high. With such a high degree of correlation, the price is bound to follow BTC.
Due to a massive cut in Bitcoin’s price, all altcoins have suffered a bearish fate. As mentioned above, Litecoin has felt the tremors as well, due to which, the returns have been affected as well. At press time, Litecoin’s yearly return was negative -27%.
Conclusion
For now, Litecoin looks rather bullish due to the formation of an ascending triangle. The targets on the higher side include $45.39 and $51.42, however, targets on the lower side include 2018 lows of $22.

![Reasons why Litecoin [LTC] investors should be concerned](https://engamb.b-cdn.net/wp-content/uploads/2023/12/ambcrypto_A_Litecoin-themed_scen-400x240.png)