Analysis
Litecoin’s devaluation continues as coin breaches descending triangle pattern
After noting steady growth in the first half of 2019, Litecoin [LTC] has been noting a gradual fall in its price. In the bearish market, Litecoin fell by over 14% in September, and it is keeping up with the trend as it has registered a fall of 6.27% in October. The price of the sixth-largest coin was $55.87, at press time, with a market cap of $3.55 billion.
The short-term chart for Litecoin recorded the coin breaching out of a bearish pattern and falling.

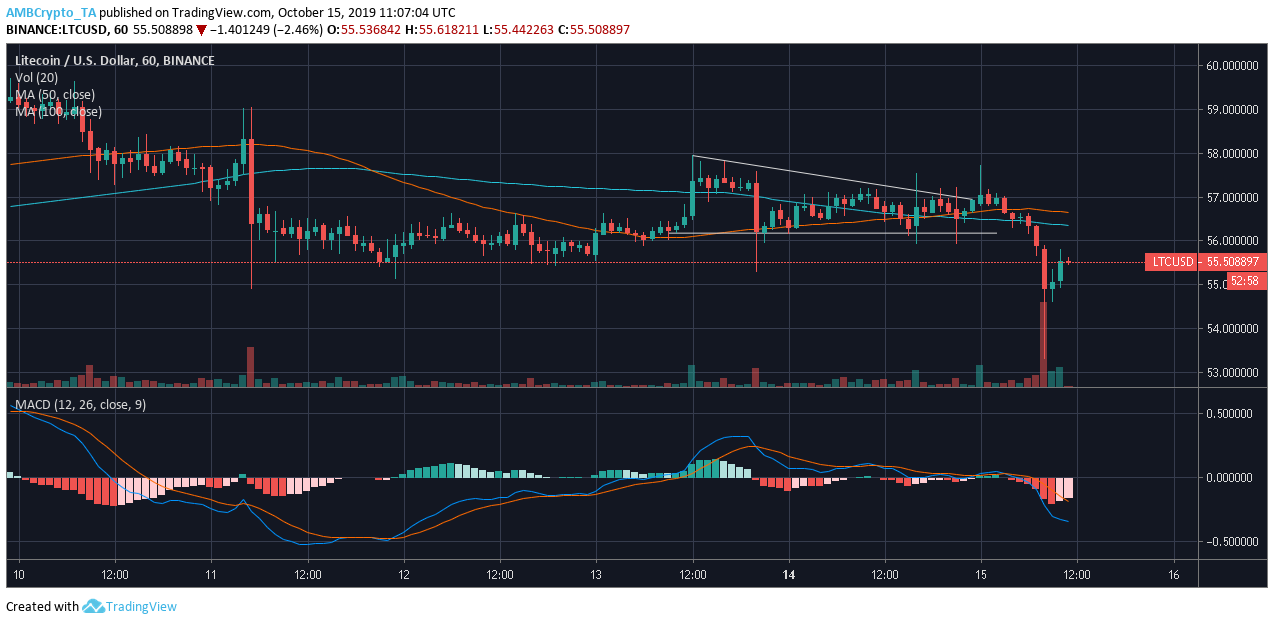
Source: LTC/USD on TradingView
The one-hour chart for LTC suggested the formation of a descending triangle that had been breached. The triangle was formed with the help of trend lines, one of which bridged the lower highs at $57.95, $57.80, and $56.95, while the second line provided the base to the forming triangle at $56.17. The price that consolidated within the triangle breached it at $56.96 and LTC experienced a fall of 6.52%, taking its price to $53.30. The coin has managed to recover by 2%, pushing its price to $55.54.
The 50 moving average remained under the 100 moving average due to a recent crossover. Since the crossover, the coin has lost 2.09% of its value and since the averages align above the candlesticks, an extremely bearish market was suggested. The MACD indicator too, reflected a bleeding market as the MACD line rested under the signal line.
Conclusion
The breach of the descending triangle pattern resulted in the fall of Litecoin by 6.52%, with a bearish market ahead.


