Analysis
Litecoin’s breach of ascending triangle might welcome a buyers’ market

Litecoin’s price has been climbing over the past few weeks, despite being beaten up in the market by the bears. The sixth-largest coin fell drastically on 16 October. However, it has been moving towards recovery since. The price of Litecoin stood at $52.43 with a market cap of $3.36 billion, at press time, with the coin noting a fall of almost 4% over the past day.
According to the longer-term chart for Litecoin, a bearish pattern was making its way and its breach may result in LTC’s devaluation.
4-hour

Source: LTC/USD on TradingView
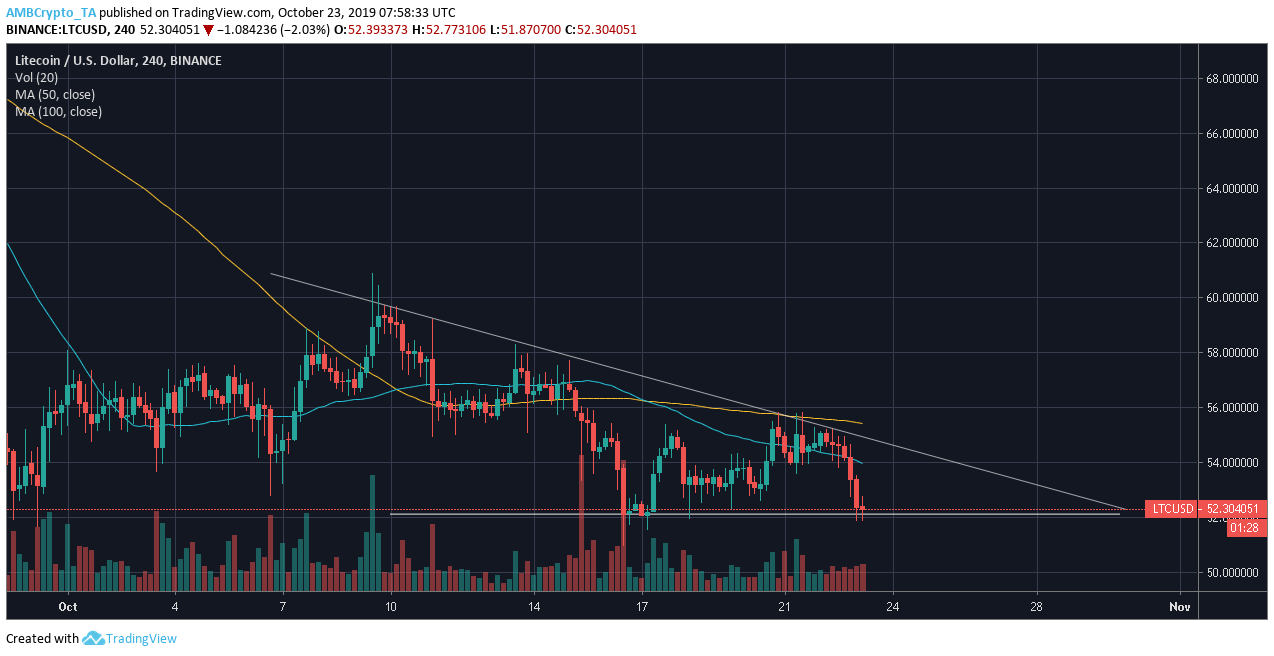
The four-hour chart for LTC noted the formation of a descending triangle. The pattern is conceived as a bearish pattern and its breach might lead the value of the coin to tumble. Characterized by two trend lines, one of them was bridging the lower highs at $59.72, $58.26, and $55.76, while the second line offered a strong base at $52.12.
The 50 moving average was noted to be under the 100 moving average, noting a bearish trend in the market. However, the alignment of the average above the candlesticks highlighted the extreme bearishness in the market.
Source: LTC/USD on TradingView
The MACD indicator also entered the bearish zone due to the crossover of the MACD line under the signal line. The indicator projected strong bearish momentum. The Relative Strength Index noted that the signal line was treading close to the oversold zone, while pointing at the bears.
Conclusion
Litecoin’s price has been falling and the descending triangle pattern might lead to another dip. With strong bearish momentum, the breach of the descending triangle might just be imminent.

