Litecoin, Tron, Dogecoin Price Analysis: 28 October

Crypto Fear and Greed Index showed a value of 70 as Bitcoin saw bullishness prevail both on the charts and on social media posts. Litecoin rose past resistance at $58.6 but showed a bearish divergence that could see a minor pullback for the asset. Tron was trading within a range and showed no signs yet of breaking out while Dogecoin was forming higher lows but the long-term trend might force the price lower.
Litecoin [LTC]

Source: LTC/USD on TradingView
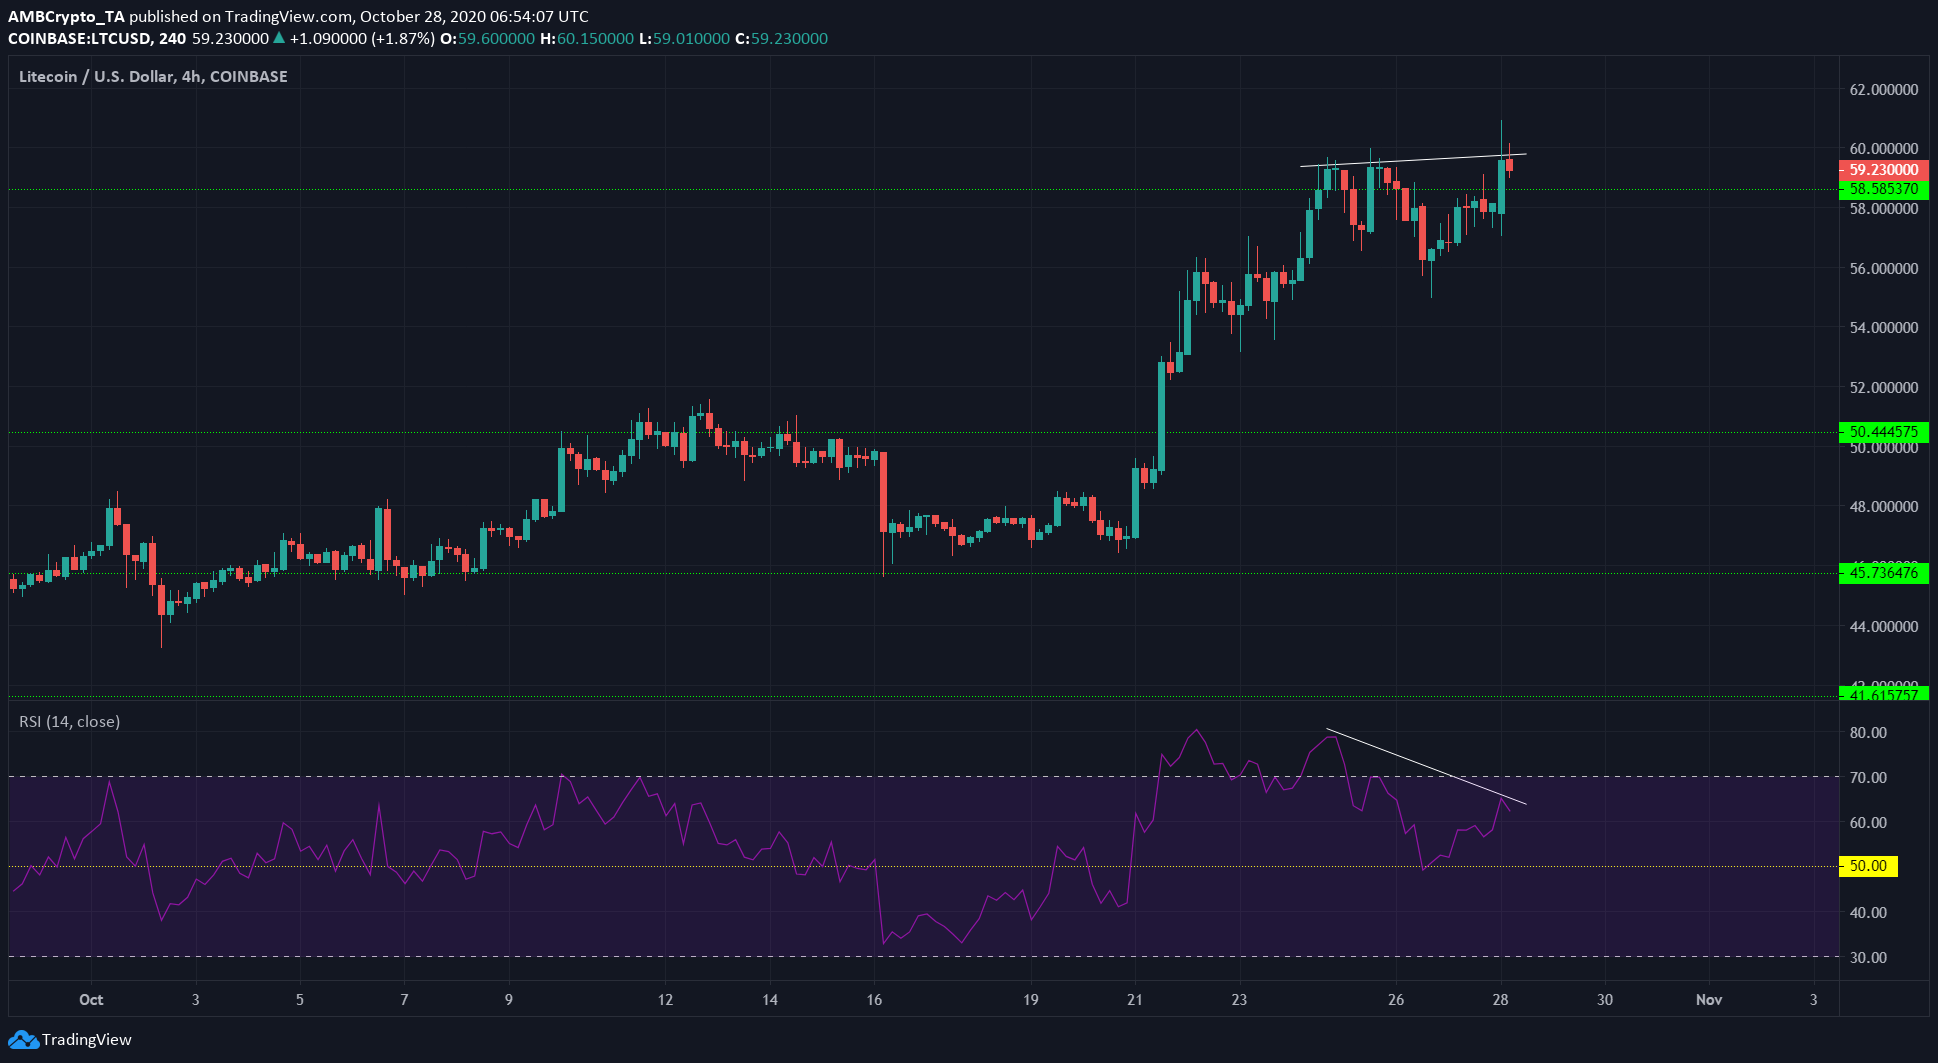
Litecoin surged past the important region of resistance at $50 and even breached $58.6 in the past few days. However, a bearish divergence was seen
The price made slightly higher highs while the RSI formed lower highs, indicating that LTC may be due for a correction.
LTC may be forced beneath the recently flipped level, to find support at $56. A close below $56 would be bearish, while a defense of $58 by the bulls would indicate more gains in the next week or two.
Tron [TRX]

Source: TRX/USDT on TradingView
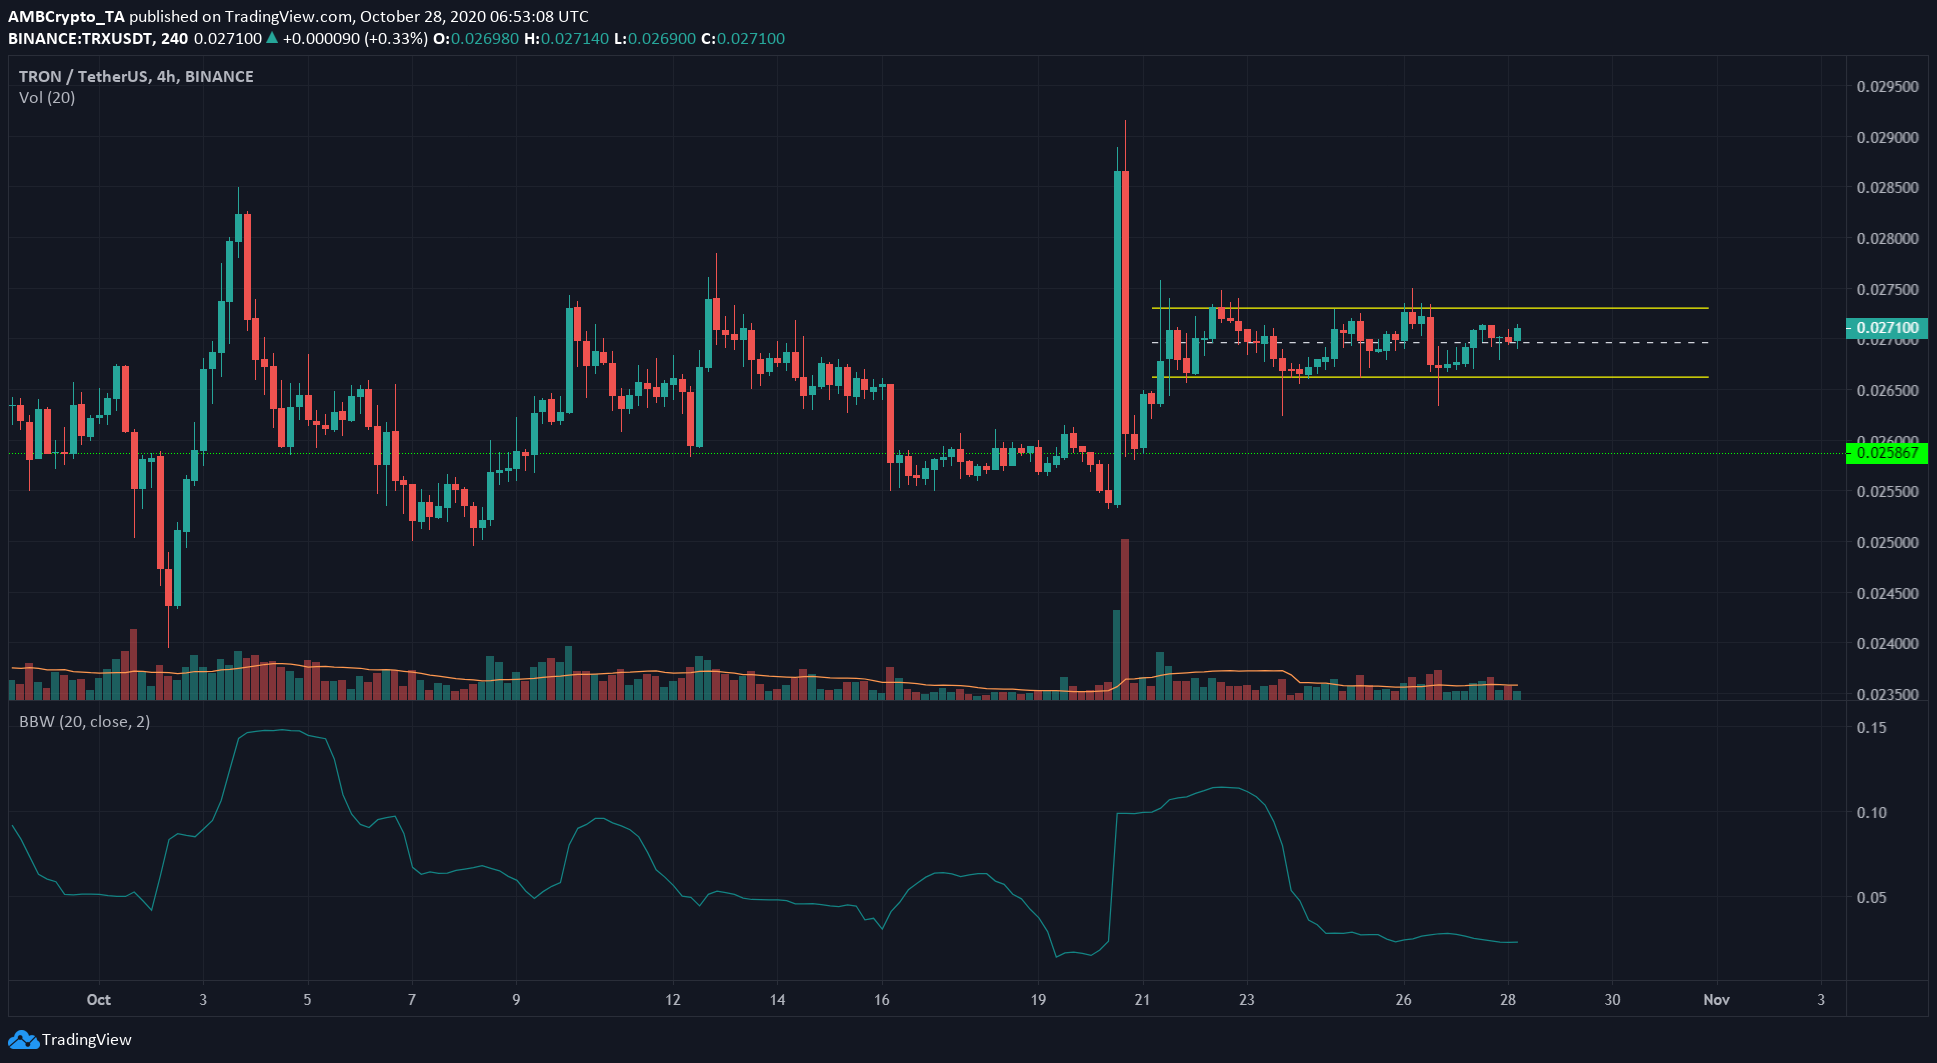
TRX moved feebly above a long-term descending trendline and was trading within a rectangle pattern (yellow). It is technically a rectangle top and generally sees a break out to the upside.
The trading volume was not as high as it was earlier in October. The Bollinger Band width also showed lowered volatility, although the lowest it has been this month was on the 19th when trading volume was also at its consistently.
A breakout to either direction will be confirmed by high trading volume as well as heightened volatility, indicated by the widening Bollinger Bands.
Dogecoin [DOGE]

Source: DOGE/USDT on TradingView
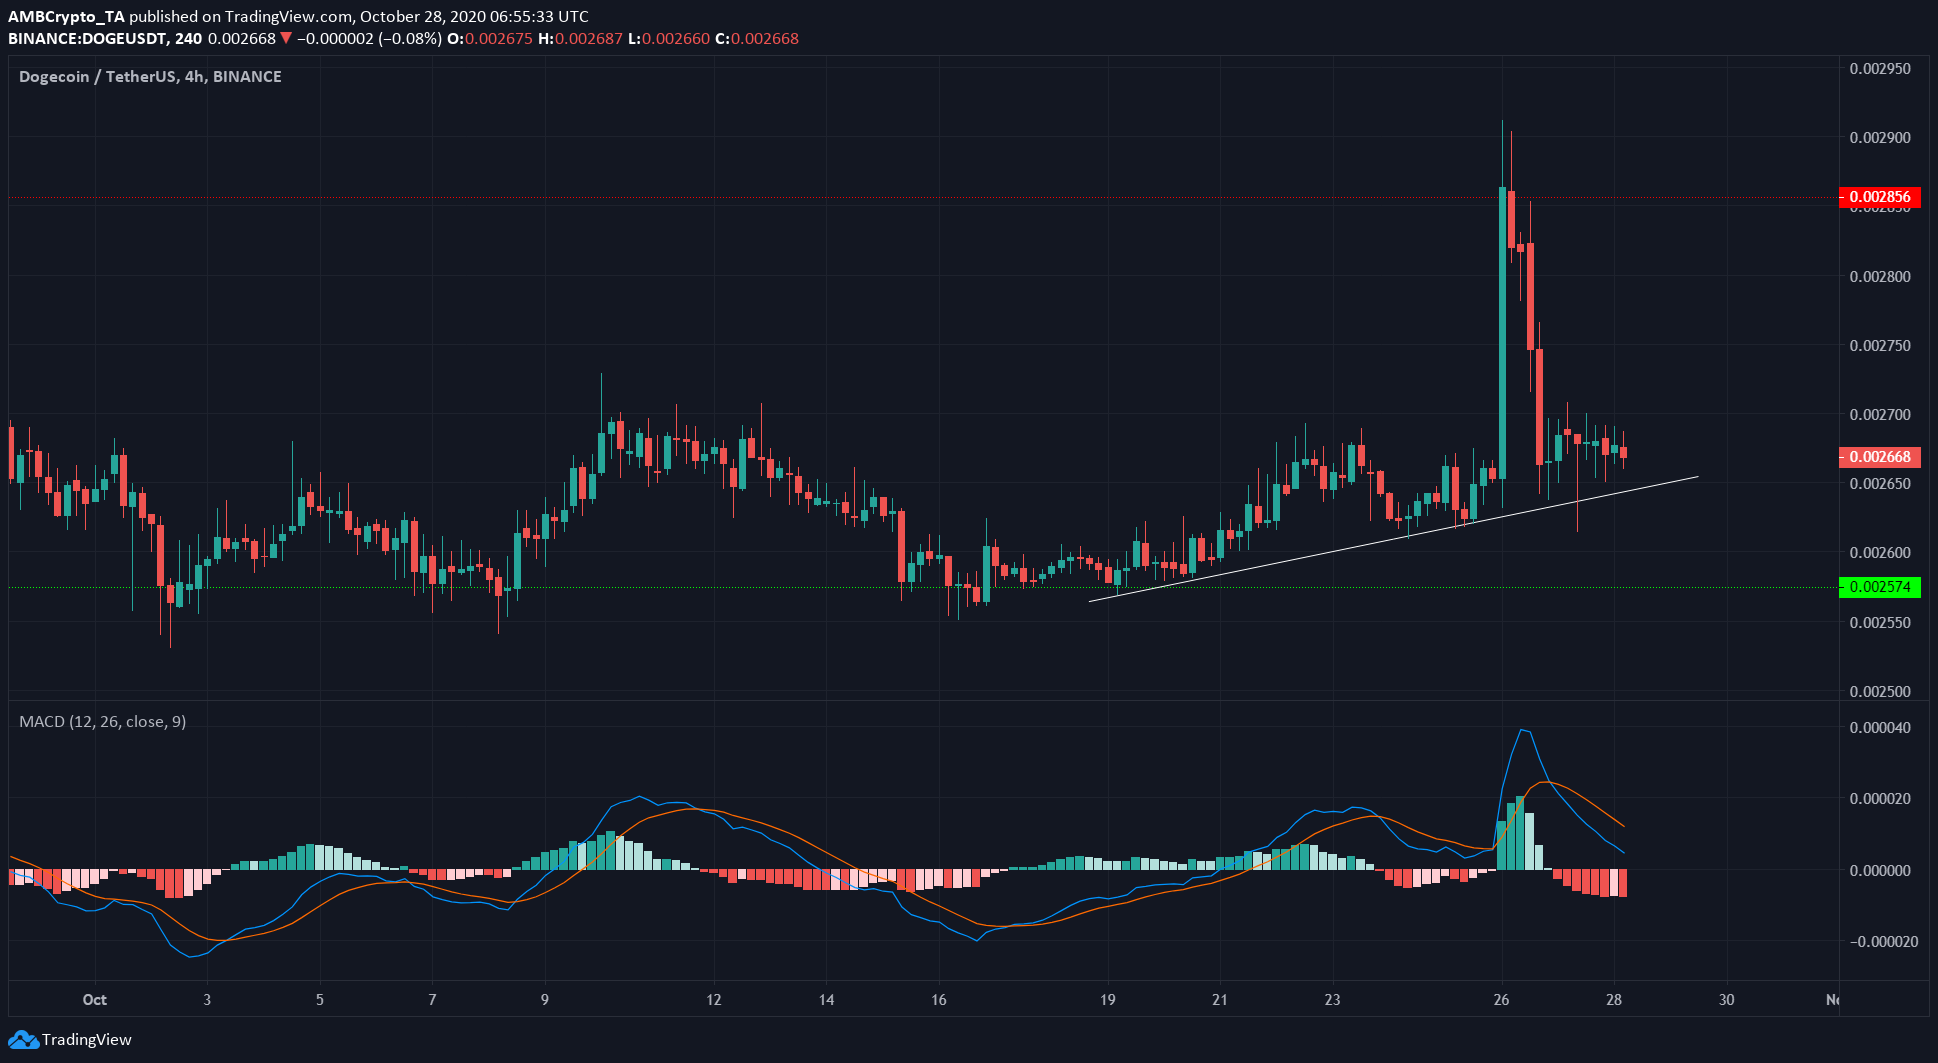
Dogecoin was forming higher lows in the past few days (white). It also recently surged to $0.002856, the next level of resistance but was rejected just as quickly.
While the price did not break beneath the rising trendline, the MACD showed a sell signal. The distance between the MACD line and the signal line in the past couple of days also showed strong bearish momentum.
A close below trendline support could take DOGE to $0.00257.


![Reasons why Litecoin [LTC] investors should be concerned](https://engamb.b-cdn.net/wp-content/uploads/2023/12/ambcrypto_A_Litecoin-themed_scen-400x240.png.webp)


