Analysis
Litecoin to escape out of the wedge; a run past $80 or a struggle at $70?

While the cryptocurrency world is ensconced with news of Bakkt confirming their September 23 launch of BTC futures, the altcoins are looking in awe. At press time, none of the heavyweight alternates to Bitcoin are trading in the thick of the green.
Litecoin, fresh off its halving, has been on a downward slump, dropping by 18.68 percent in the past week. Digital Silver which reached as high as $144, is now trading at around half of the price, owing to a price fall dropping the coin to its lowest point since May 10.
SHORT TERM:

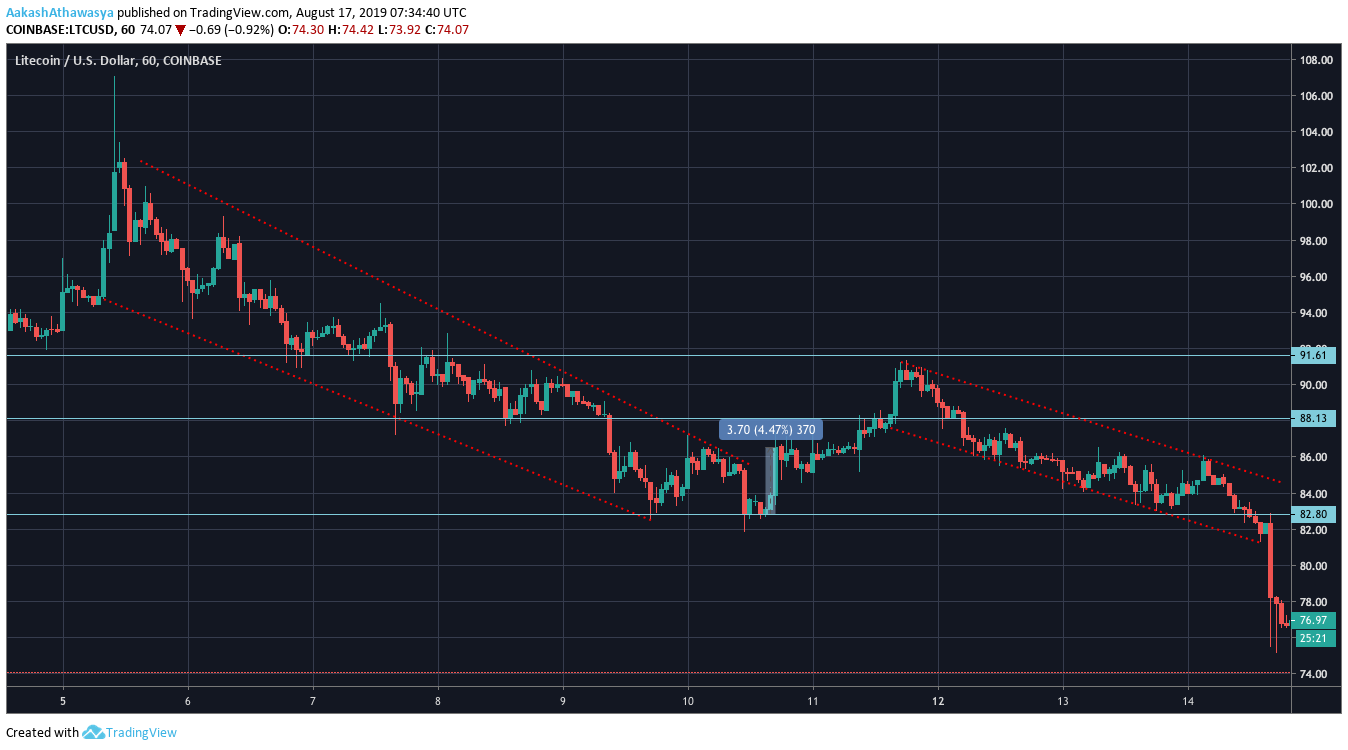
Source: Trading View
Litecoin broke out of its falling wedge which persisted from the 5th to the 10th of August, taking the price down from $102.63 to as low as $82.57. Immediately after the same, the price rose by close to 5 percent within a 3-hour window between 1400 UTC and 1700 UTC, on the 11th. This price drop broke two successive support levels placed at $91.61 and $88.13, and bounced off the third support at $83.8.
On 14 August, the aforementioned support which lasted a mere 72-hours was broken, as LTC broke out of a downward channel. During the same, the continuously descending lower highs were recorded at $90.84, $87.37 and $85.85, and the lower-lows were at $85.6, $84.15 and 83.27, following which the drop occurred. Within a period of 1 hour, Litecoin slumped past its channel, dropping by 4.96 percent, to under $70, well past the previous support.

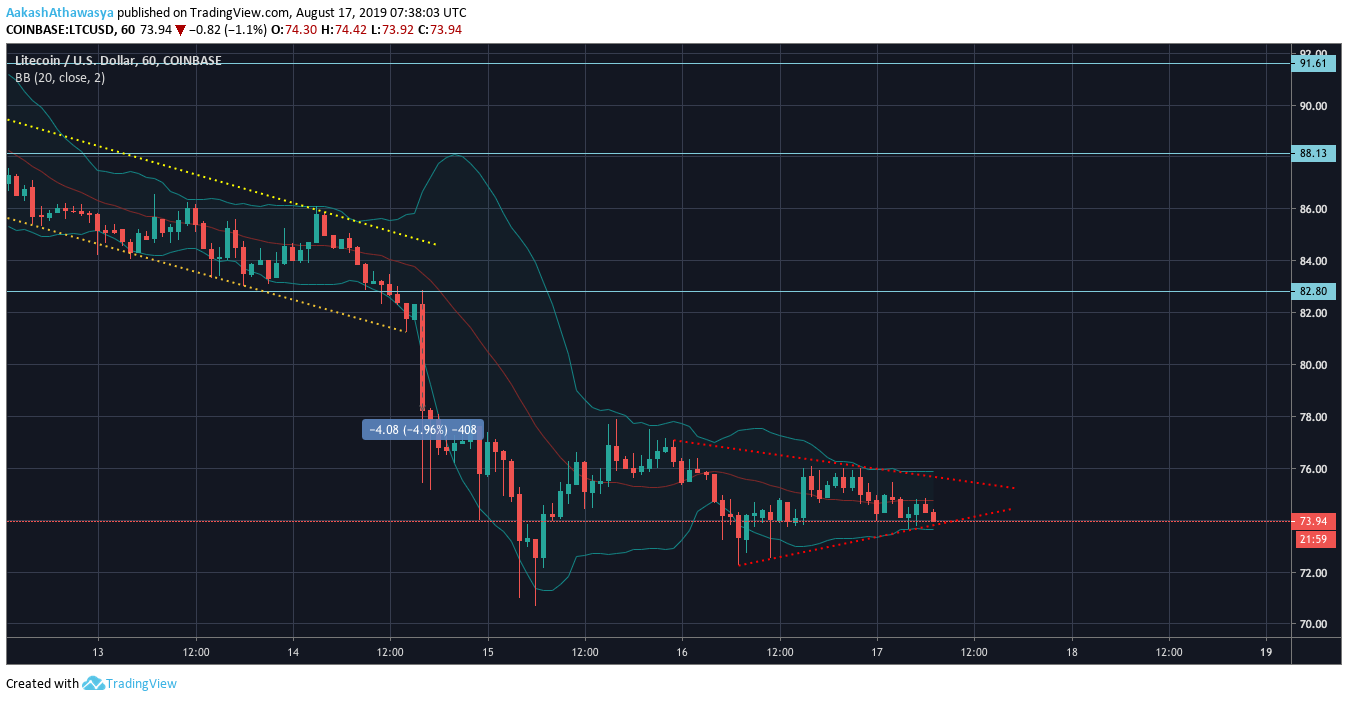
Source: Trading View
With some back-and-forth movement, the cryptocurrency dropped to $72 and then to $77 between 0600 to 2300 on 15 August, now looks to enter a pennant. The hourly chart indicates another set of lower-highs and lower-lows, with an upward breakout on the horizon.
Based on the structure of the pennant, a rise could be seen in the next couple of days. The bearish market for LTC can be confirmed with the Bollinger Bands moving parallel indicating low volatility and the candlesticks dropping below the red-line at the start of 17 August.
ZOOMING OUT:
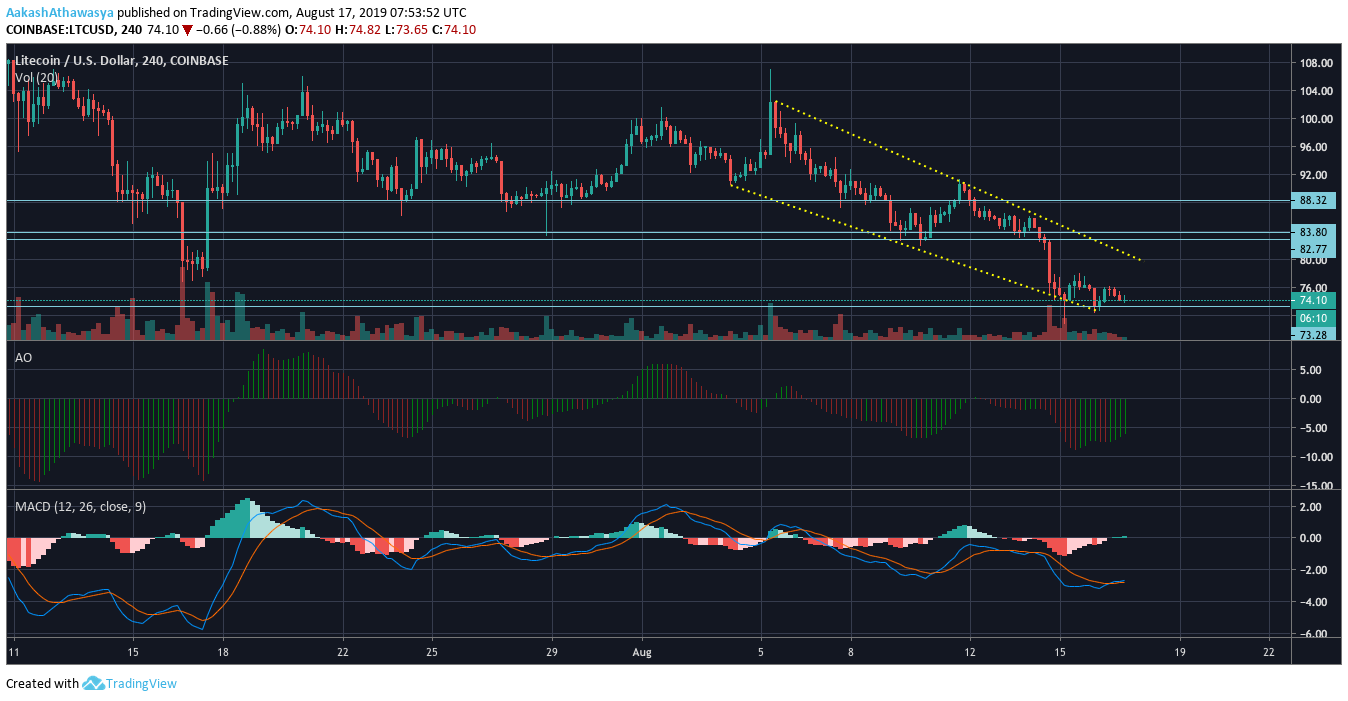
Source: Trading View
The descending channel has been persistent and steep in the LTC market for almost two weeks now, with the price in a continuous free fall following the halving. The 4-hour chart indicates that three continuous support levels formed while the prices have been trading in the channel have been broken at $88.32, $83.8 and $82.77, with the price bouncing back off the final support level at $73.28.
On the basis of key indicators, Litecoin looks to be slumping in momentum like price. The Awesome Oscillator indicates that the short term momentum is lower than the coin’s long term momentum, but the concluding bars are green, indicating surging activity up ahead. The MACD indicator also shows a bullish switchover, albeit for a short period, as the MACD line is above the Signal line.
Based on the information in the short time frame, the price, which at press time stands at $74.06 could rise to as high as $78 and if the momentum holds, which looks likely, a breakout over $80 is also foreseeable.