Analysis
Litecoin short-term Price Analysis: 24 November
Improving by 20% over the past week, Litecoin managed to climb back up to 7th in the digital asset rankings. The price is at $90 at the moment, with the first $100 re-test for 2020 in sight. While the market is slightly bearish at the moment, a bullish rally may unravel again over the next few hours.
Litecoin 1-hour chart


Source: LTC/USD on Trading View
The short-term chart of Litecoin indicated that the asset is currently oscillating inside an ascending channel pattern. While the pattern speaks of a bearish outcome, the collective bullish momentum in the market is unlikely to diminish at the moment.
The 50-Moving Average is playing a key role in keeping the asset above as underlying support but the support at $80 is still active. The consistent trading volume in LTC suggested some of its traders were re-entering its market at the moment.
Market Reasoning

Source: LTC/USD on Trading View
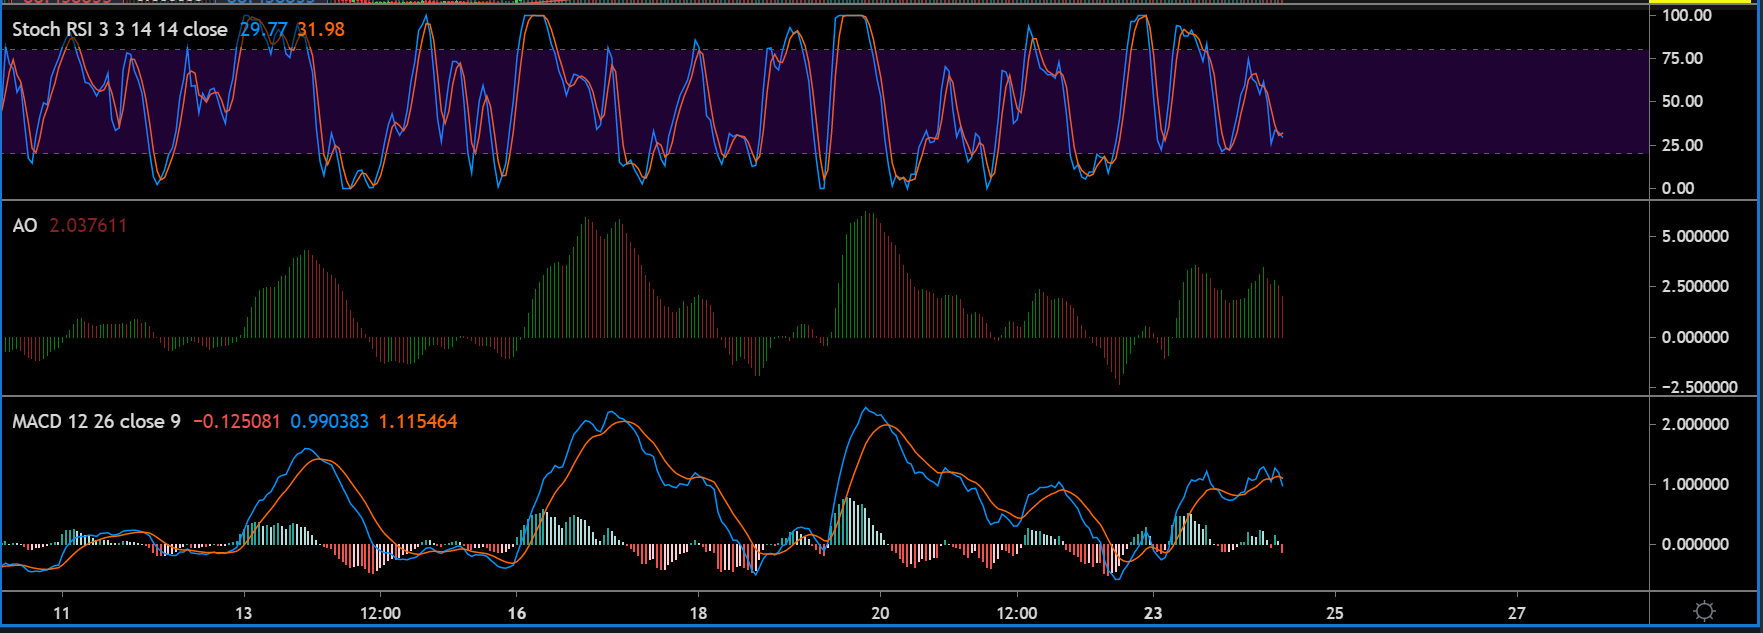
The current market indicators are suggestive of a bullish rally as exhibited by the collective sentiment. Stochastic RSI is nearing an oversold range and any reversal from here on will lead to the eventual re-test at $100. Awesome Oscillator or AO is indicative of a dropping bullish momentum at the moment, with a possible reversal in the horizon.
Lastly MACD is a little bearish at the moment, which is definitely due to the slight drop in the current market.
Conclusion
To be fair, setting up a long or short position at the moment, is extremely risky. The price is under a choppy period, displaying both bullish and bearish structure. Ideally, a little bit of stability may give us more direction as Litecoin eventually covers ground to re-test the $100 range.

![Reasons why Litecoin [LTC] investors should be concerned](https://eng.ambcrypto.com/wp-content/uploads/2023/12/ambcrypto_A_Litecoin-themed_scen-400x240.png)