Analysis
Litecoin short-term Price Analysis: 18 August
Disclaimer: The following article attempts to analyze the emerging trends in the Litecoin short-term market and its impact on price.
Litecoin, at press time, was being shoved between important resistance and support, despite an overall bullish market. The price of cryptocurrencies was witnessing great bullish bursts on Monday, however, Tuesday looked like there was a correction setting-in.
Litecoin’s price in the past hour broke down to $64.50, after which it bounced back up and was currently trading at $65.74.
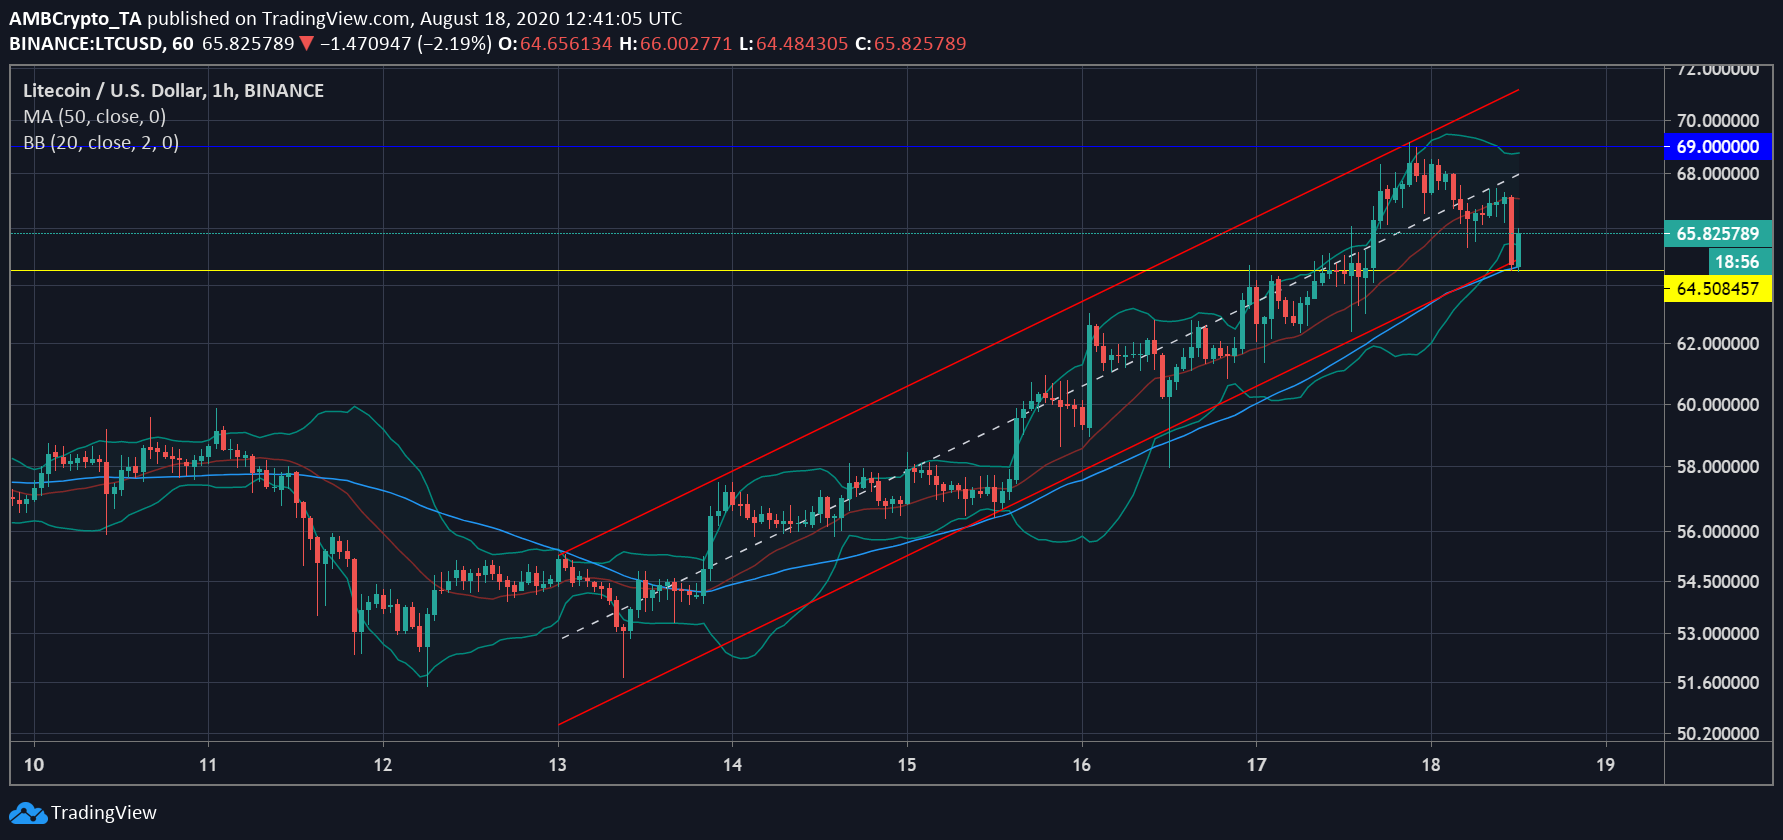
Source: LTC/USD on TradingView
As the LTC price touched the yearly high of $69 on 17 August, the price began to shrink. This peak was last witnessed by the coin in February 2020 and has been tested thrice since. This point marks an immediate resistance for the LTC price to breach, whereas, the recent slump in its price pushed it to $64.50, which has been the support marked by the 50 moving average.
As the average remained under the candlesticks, the trend in the LTC market was extremely bullish as was marked by the Relative Strength Index. However, the recent breakdown of price brought the moving average closer to the price bars and a crossover would spell the bearish market for Litecoin. But, the Bollinger bands have been indicating growing volatility as the price of LTC was rising again and affirming a bullish trend.

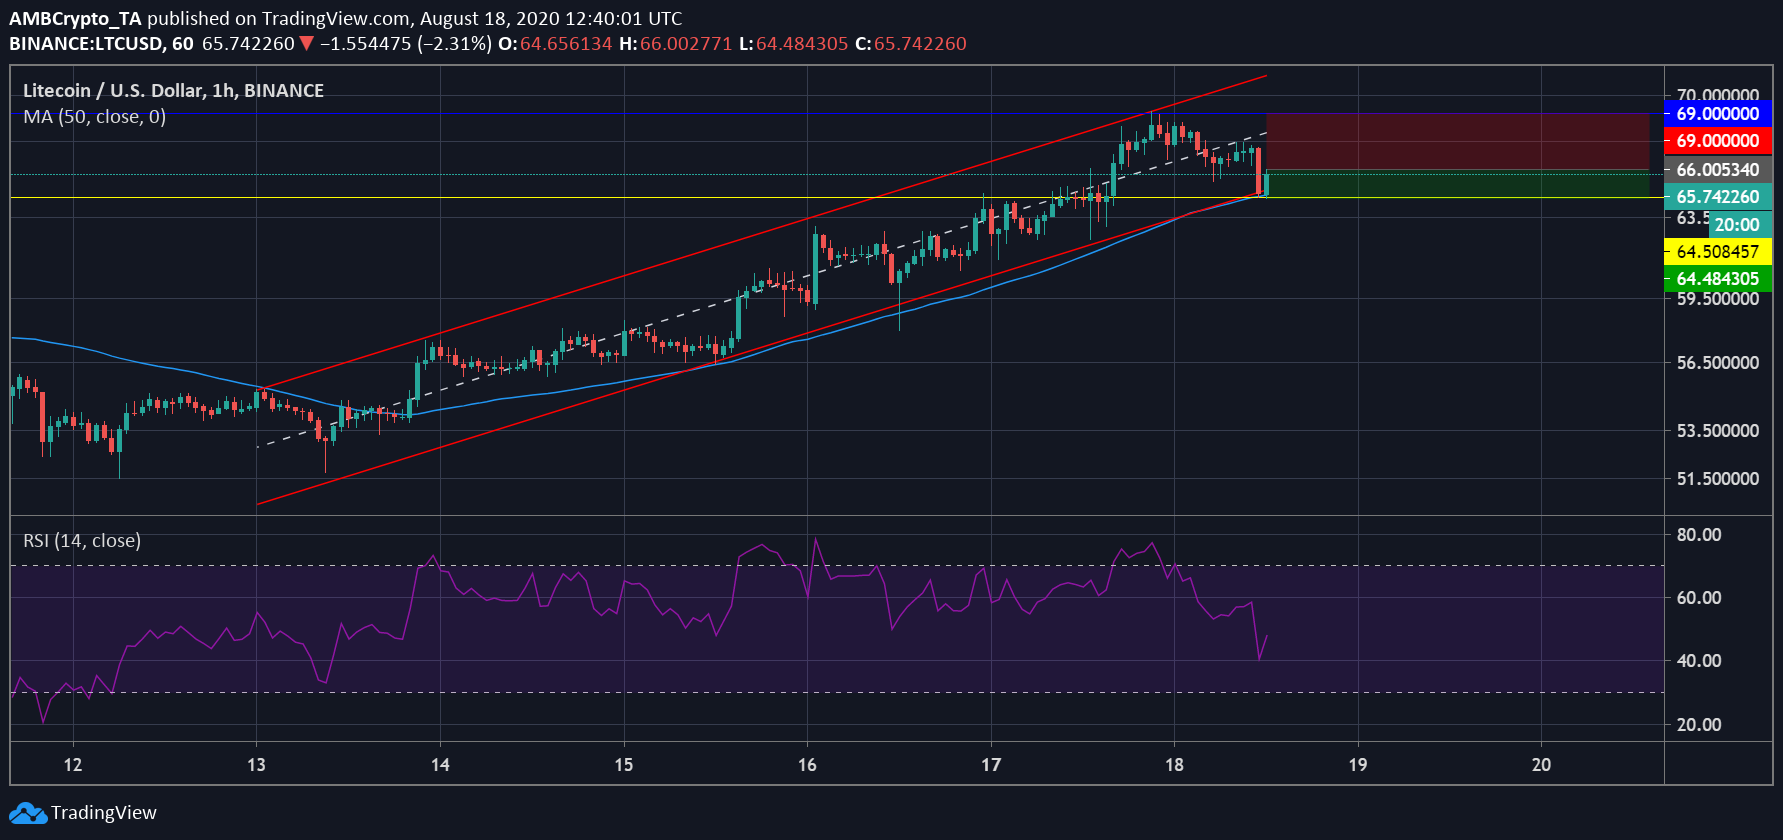
Source: LTC/USD on TradingView
Due to the presence of strong resistance at $69, a re-test is likely. At press time, a shorting position with a price entry of $66.29 would incur a risk/reward ratio of 1.34, if the valuation depreciated to $64.50. Stop losses would be placed at $67.5 as the price has been considering this immediate resistance and falling.
With 50 Moving average acting as strong support at $64.50, the window to short may change to a long position as well.