Analysis
Litecoin set to breach descending channel amid high selling pressure

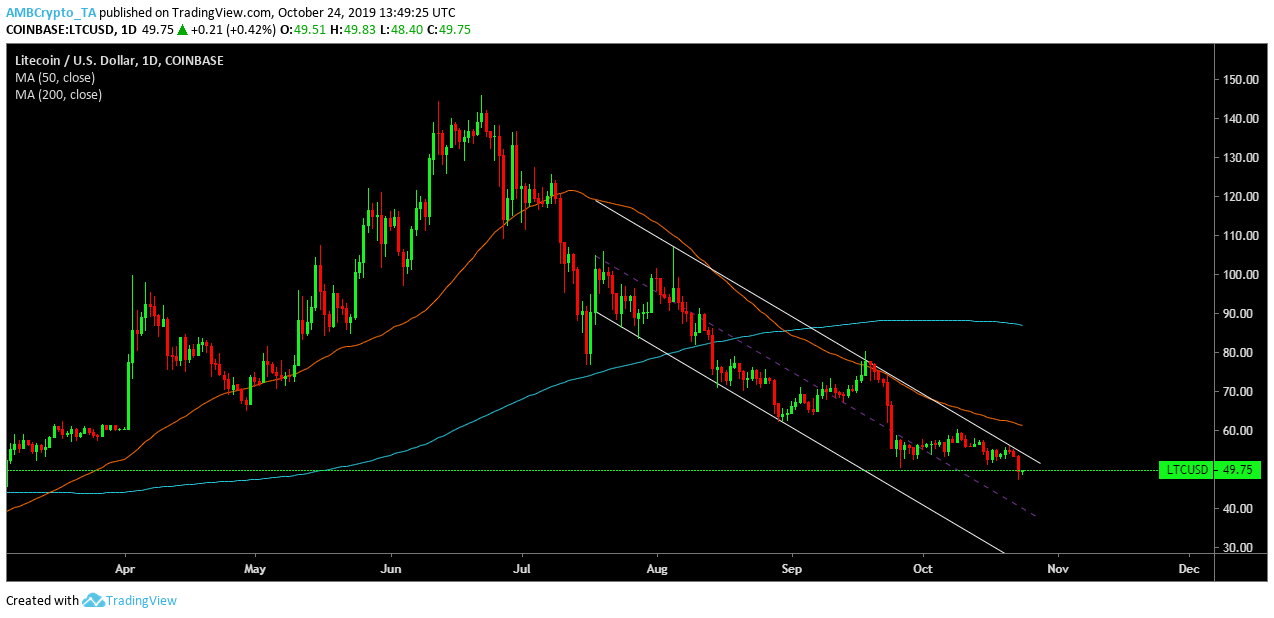
Litecoin’s price hasn’t seen any signs of revival since July, and the block reward halving in August did not help its cause either. The altcoin was trading at $49.92, at press time, having fallen by a minute 0.01% on the 24-hour price chart. The altcoin might see some green in the long term as it is well set to breach the descending channel pattern.
1-Day Price Chart

Source: LTC/USD on TradingView
On the one-day price chart, Litecoin was moving in a descending channel since the middle of July, and it might well breach the pattern in the coming weeks, pushing its price to the green. A descending channel is characterized by the formation of higher lows touching the channel at $107.24, $78.52 and $56.28, while the lower lows formed at $86.25, $71.04 and $62.29. A descending triangle is considered bullish as a breach from the pattern often occurs in an upward direction.
The 50-day moving average went under a death cross on 30 August, with the 100-day moving average which is a bearish sign. However, with the formation of a descending channel, bearish sentiment might see a reversal.
Source: LTC/USD on TradingView
The MACD indicator is on the verge of a bearish crossover which might be because of the sudden price drop in the market yesterday. With the breach of the descending channel, the indicator might see a reversal in sentiment.
The RSI indicator suggested that sellers had an upper hand for the most part. However today, it started to see an uptick as the buyers might push to dominate in the next weeks.
Conclusion
Litecoin has been moving in a descending channel pattern for almost 3 months and a breach from the pattern would send the price of the altcoin to the green. The MACD indicator looked bearish in the short-term while the RSI indicator suggested that although sellers had an upper hand, buyers have started to put some pressure.

