Analysis
Litecoin, Polkadot, Verge Price Analysis: 09 November
Litecoin’s most recent bounce off the support level appeared not to have the backing of willing buyers, with the same suggesting that a drop in price was imminent. There was also a level of strong resistance just above Litecoin, a level it might not be able to test over the next few days.
Polkadot was similar to Litecoin, and a close under the support level could contribute to further losses for DOT. Verge was also posting higher lows, even as its price was whipsawed by heightened volatility.
Litecoin [LTC]
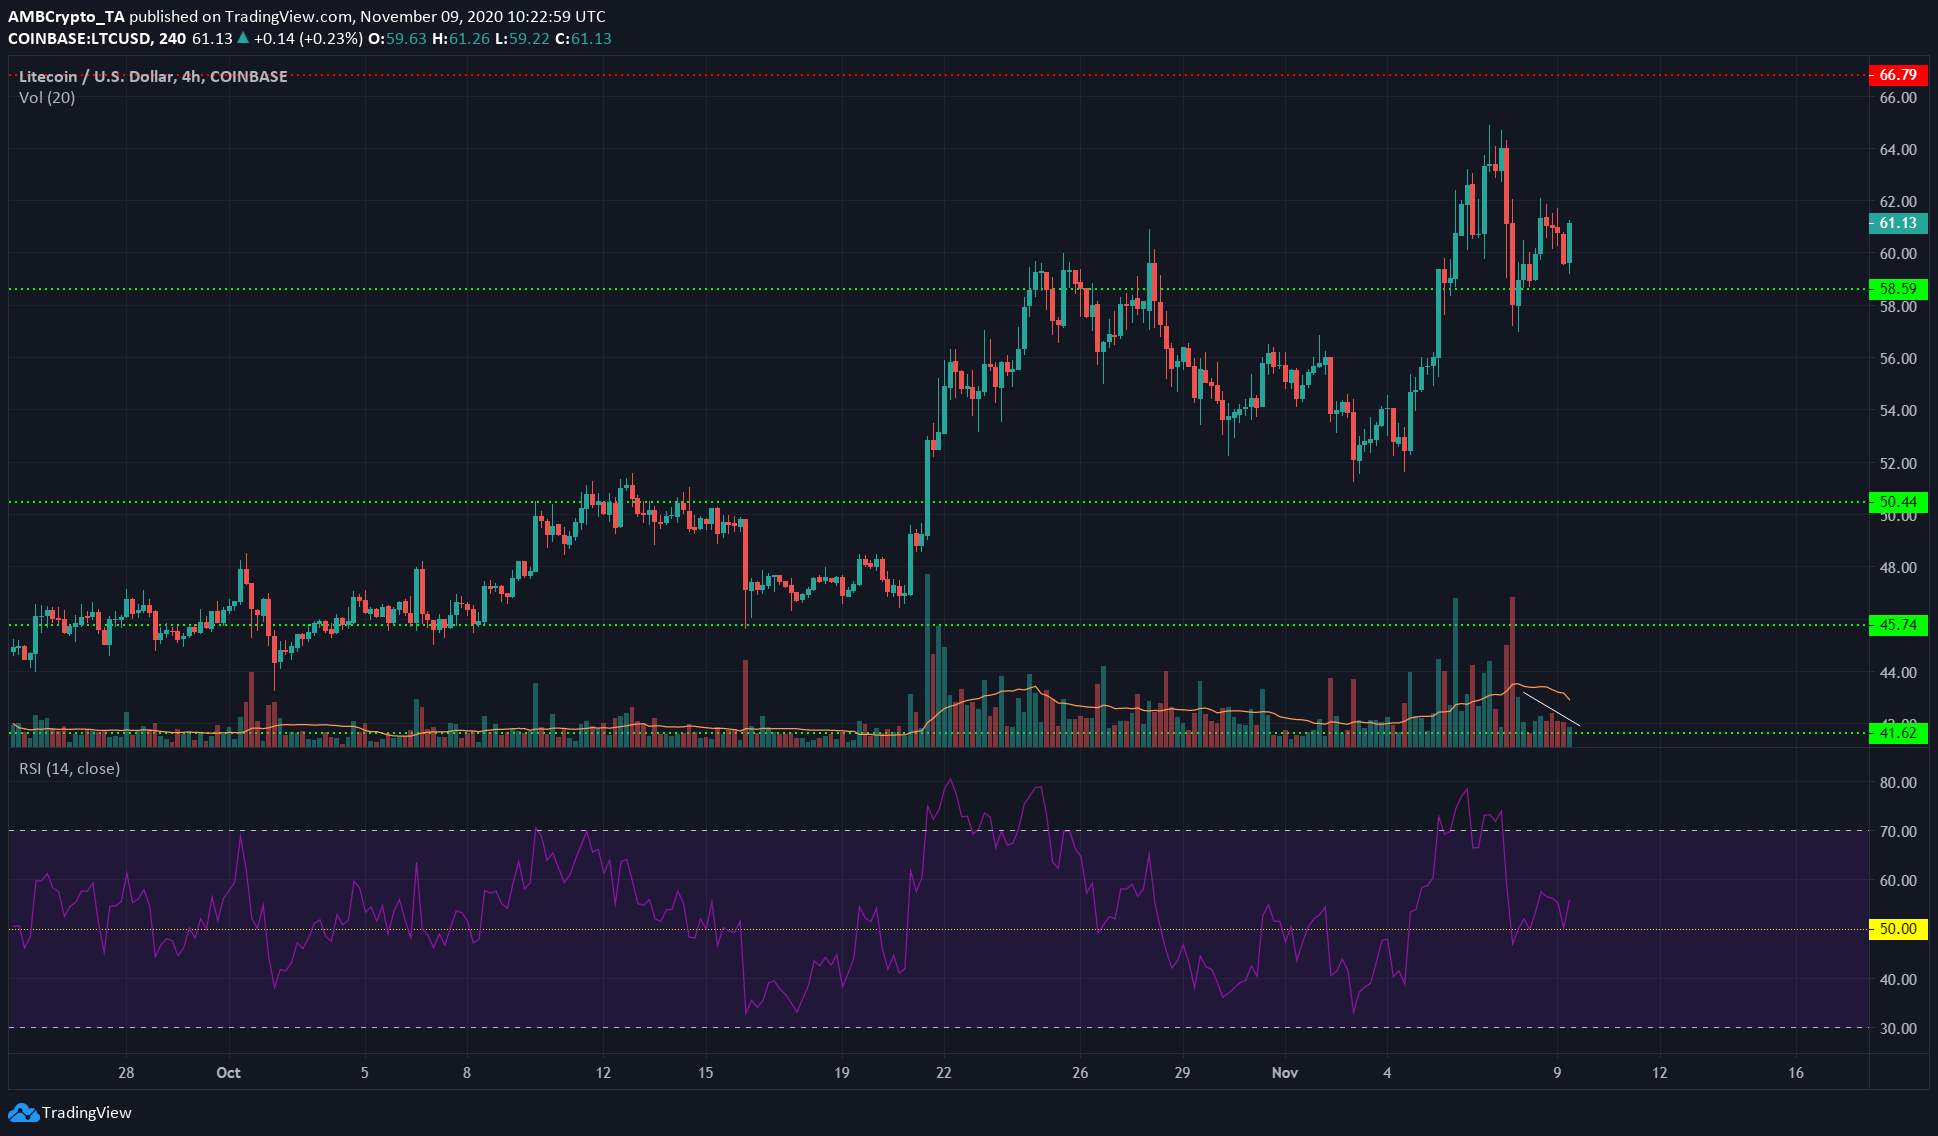
Source: LTC/USD on TradingView
The RSI showed that LTC was still on an uptrend as it bounced off the neutral 50-zone. And yet, the trading volume over the past few sessions has been underwhelming. In fact, the volume did not register a surge in buyer interest as LTC dipped towards its support, suggesting a disagreement, and that bulls could be exhausted.
LTC would need to rise past $63, with decent trading volume on the charts, to boast a bullish outlook in the coming days.
Even then, $66 was an imminent level of strong resistance. LTC traded above this level back in February this year. It remains to be seen whether the bulls have the wherewithal to breach this resistance.
Polkadot [DOT]

Source: DOT/USDT on TradingView
Like Litecoin, DOT’s most recent bounce was also not supported by significant trading volume.
The OBV has been trending lower over the past two weeks. However, it was northbound over the last few days. The long-term trend is quite often the stronger trend, suggesting that DOT might register some losses soon.
The Fibonacci retracement levels for DOT’s rise from $3.6 to $4.95 in October showed that the 50% level at $4.27 has been a solid level of support. A drop below this could take DOT to $4.11.
The price also wicked up to the resistance at $4.43, but it was rejected swiftly.
Verge [XVG]
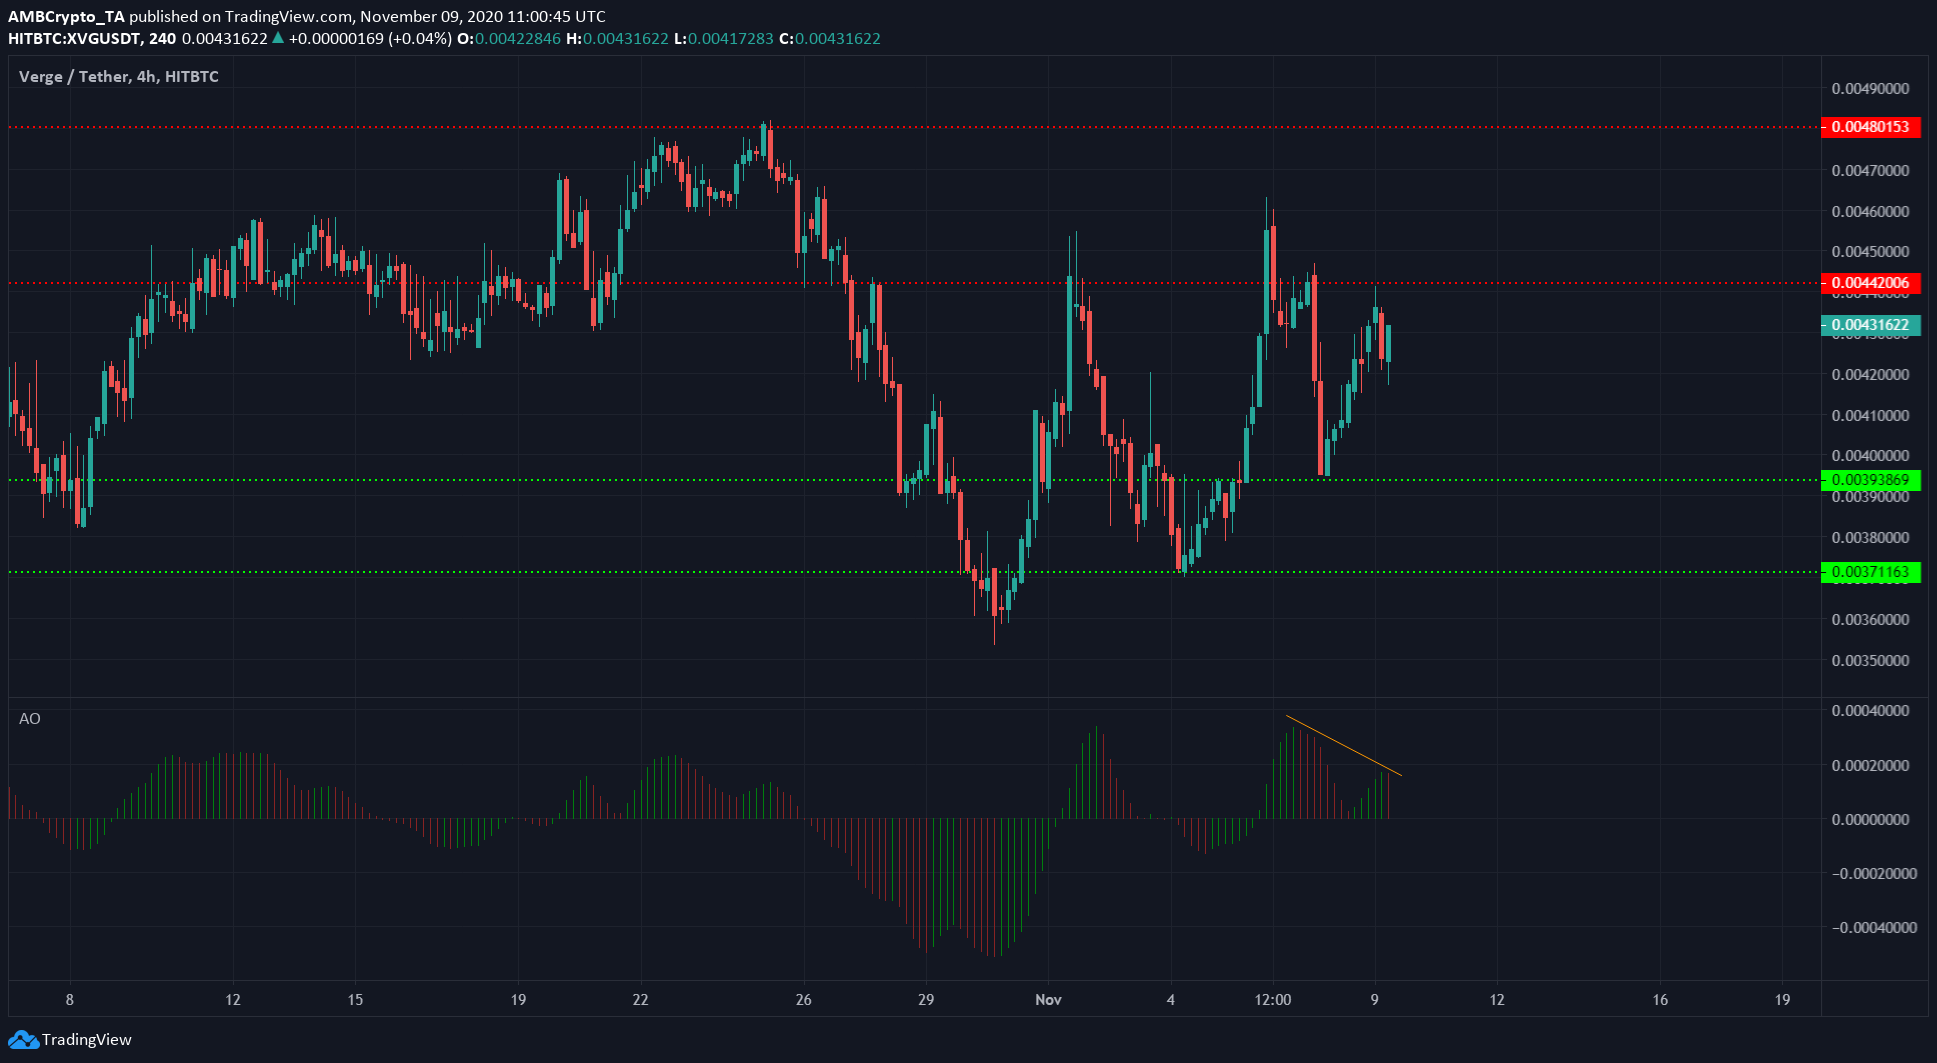
Source: XVG/USDT on TradingView
The Awesome Oscillator formed a bearish twin peaks setup (orange) and signaled an imminent drop in price. However, the month of November saw XVG set a series of higher lows.
At the same time, the volatility for the crypto-asset was high. It had posted gains of nearly 22% in a single day, and a drop of 16% over two days, and another 22% surge in two days, off the $0.0037-support level. This could be attributed to Bitcoin and Ethereum’s recent movements influencing XVG.

![Reasons why Litecoin [LTC] investors should be concerned](https://eng.ambcrypto.com/wp-content/uploads/2023/12/ambcrypto_A_Litecoin-themed_scen-400x240.png)