Litecoin, NEM, FTX Token Price Analysis: 25 October

While Bitcoin did climb to $13,361 on the charts, it was soon forced to drop down to $13,016 in a matter of minutes. The decoupling of Bitcoin from traditional markets can be seen as a long-term bullish sign for the asset. Further down the crypto-ladder, Litecoin could be set to retrace some of its recent gains, while NEM was trending lower. Also, FTX Token had a bullish outlook as buyers flocked towards it.
Litecoin [LTC]

Source: LTC/USD on TradingView
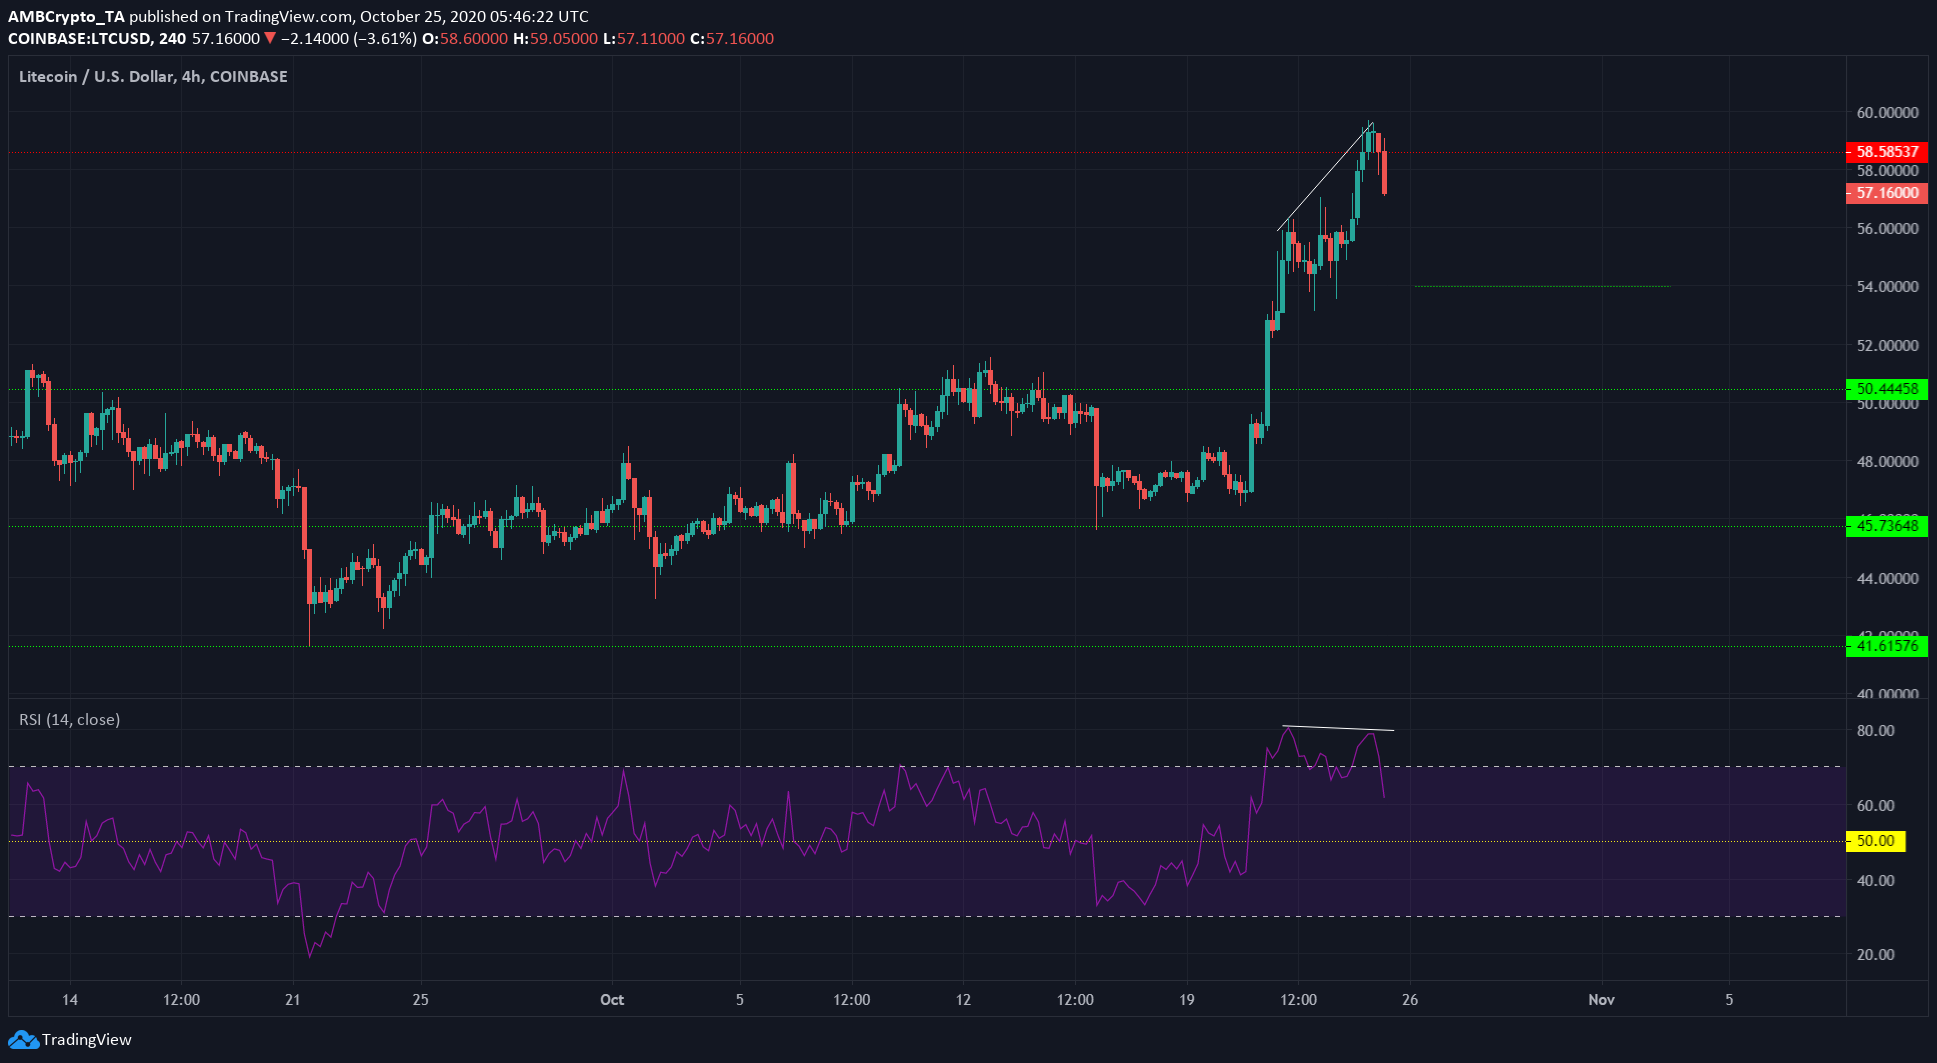
Litecoin soared past its resistance level at $58.5 and formed a Doji candle. During the same trading session, a bearish divergence between the price and momentum was also noted.
This, along with Bitcoin’s drop, contributed to losses of nearly 3% over the past few hours, with more losses expected to be seen.
The zone around $54 had acted as support previously and can be expected to serve similarly once again.
In related news, the Litecoin Foundation announced that its partner Cred “supports Litecoin in all 50 states” of the USA to allow earning of compound interest on crypto.
NEM [XEM]

Source: XEM/USD on TradingView
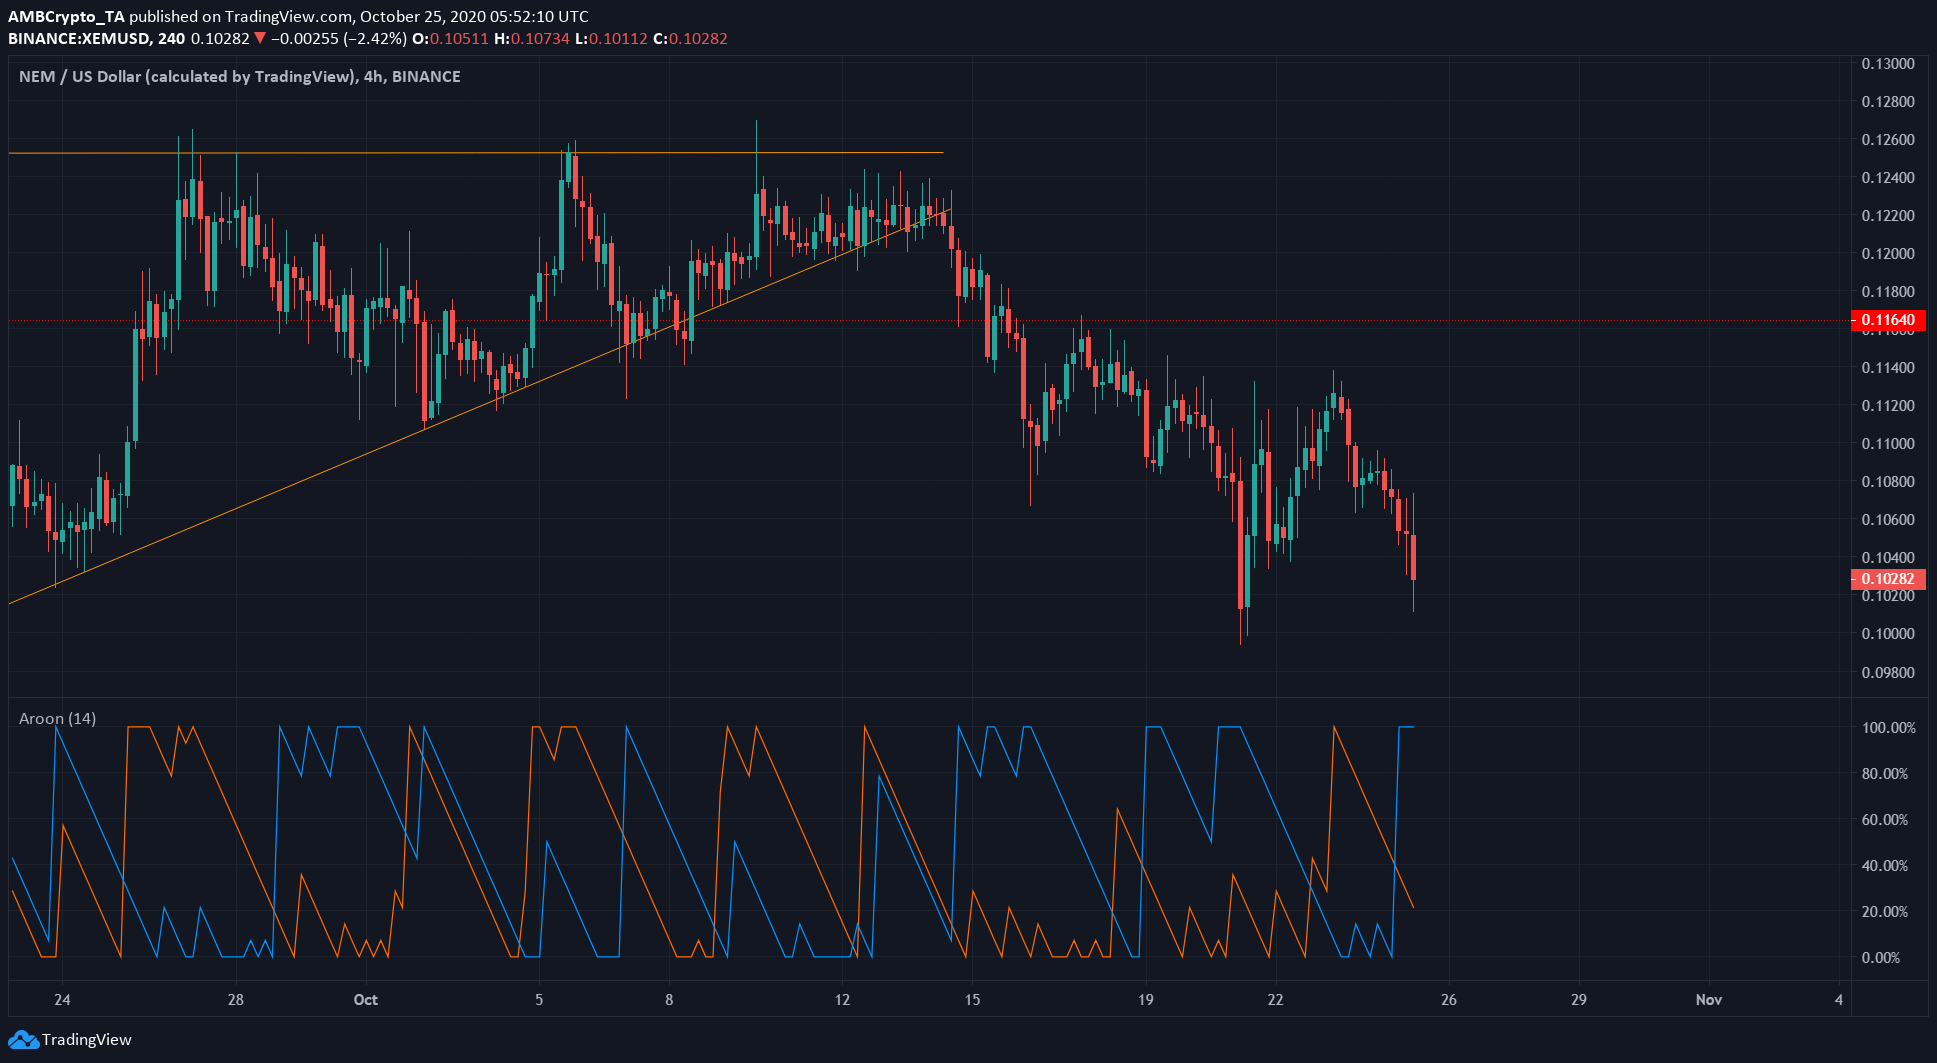
An ascending triangle (orange) had formed over the past month. A bullish pattern, it was invalidated when the cryptocurrency’s price slid beneath the ascending triangle and lost the support at $0.116.
Further, the Aroon Indicator showed that over the past couple of weeks, the trend has been predominantly bearish. The next level of support lay at $0.095, and XEM could be set to trend even lower on the charts.
FTX Token [FTT]

Source: FTT/USD on TradingView
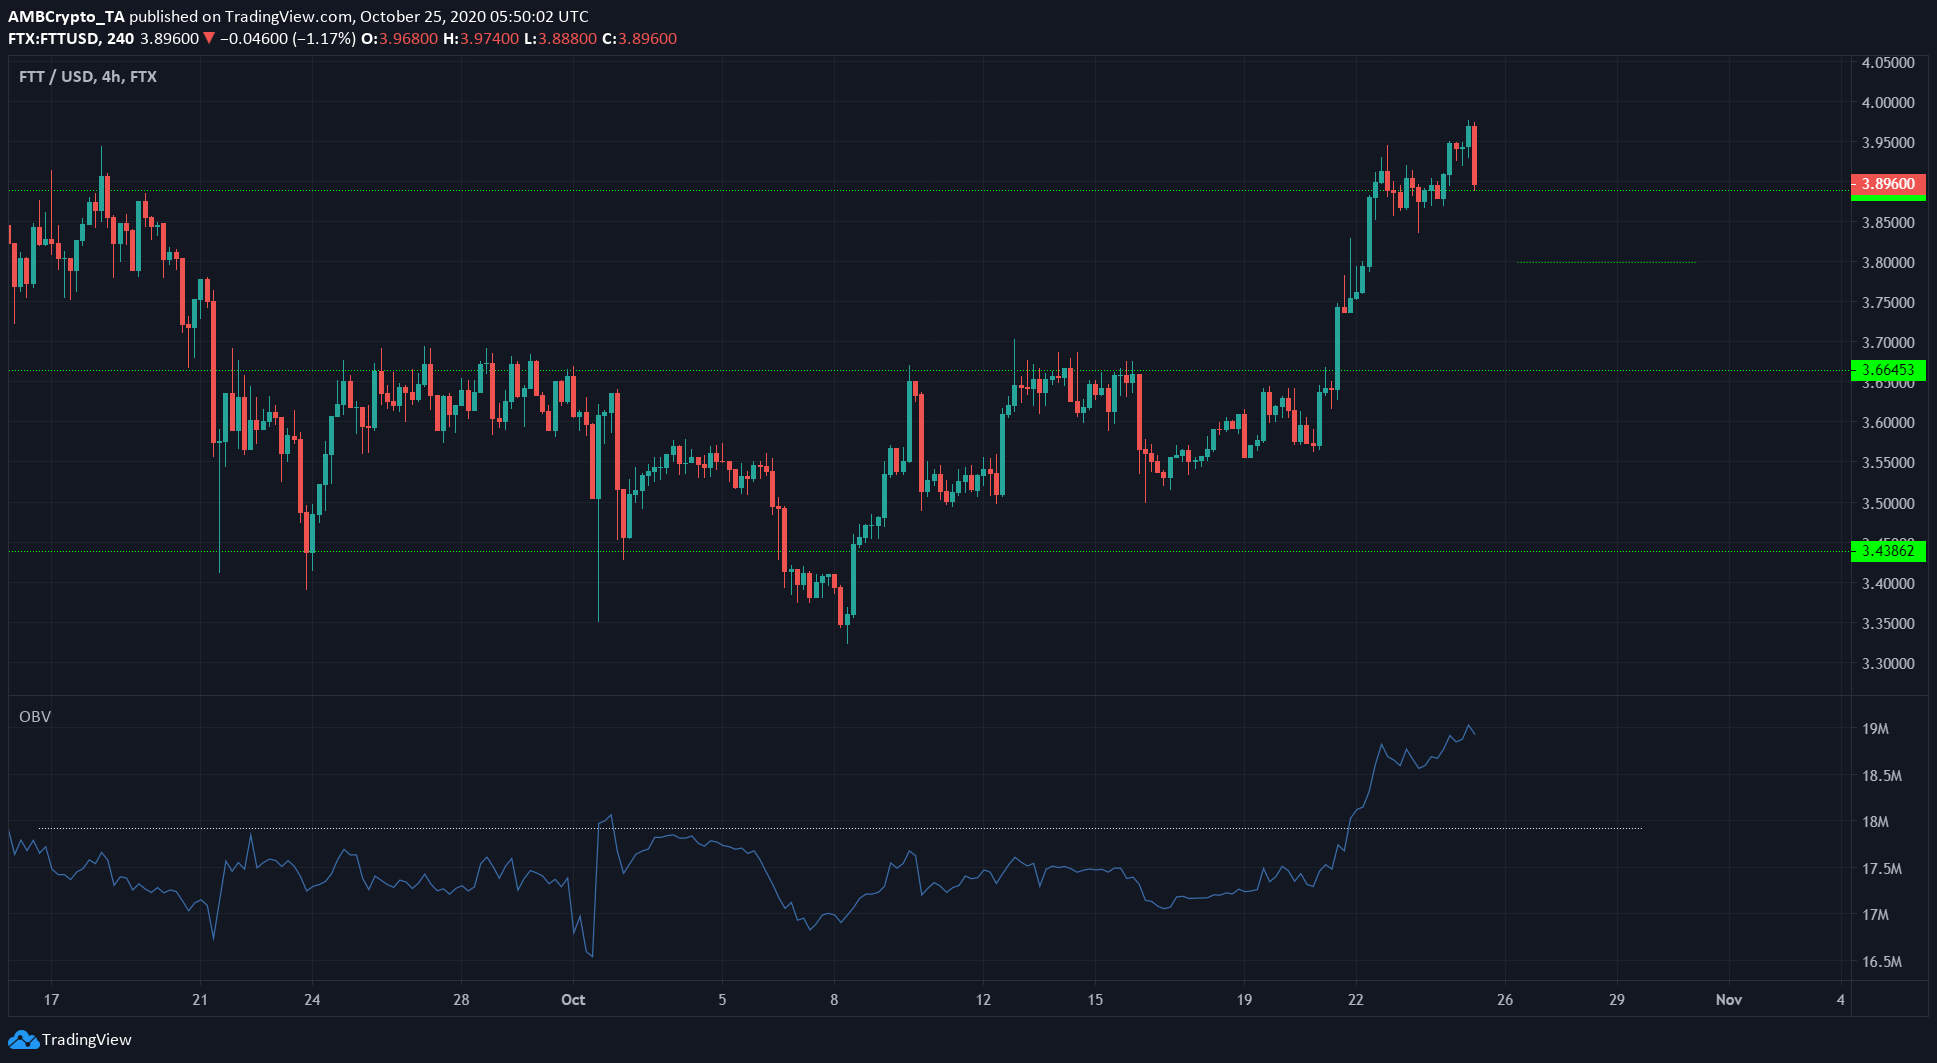
While FTT had been unable to move past the $3.66-level, it recently did break out. In fact, the price breached the $3.89-resistance and, at press time, had moved to retest the same in a drop coinciding with Bitcoin’s.
Further, the OBV highlighted how buying volumes have backed the rise of FTT. The white, flat trendline on the OBV was breached with force by the market’s bulls.
The level at $3.8 can be retested if the support at $3.89 does not hold. FTT had a bullish outlook, so a drop under $3.8 looked unlikely at the time of writing. The aforementioned levels can be good entries for long positions.
