Analysis
Litecoin long-term Price Analysis: 27 October
Disclaimer: The findings of the following article attempt to analyze the emerging patterns in the Litecoi long-term market and its impact on the price.
The ball has been set in motion for an altcoin rally as Bitcoin sees a renewed interest in the market. Although many altcoins were devoid of much volatility in the past, this rally has provided a chance to break out of the consolidation and move higher. Litecoin [LTC] has been reaping benefits of this Bitcoin-driven growth and has been trading at $57.55, at press time.
The digital asset was bouncing between $42 and $54 for a long time and as it tested the support at $46 once again, the price surged to a peak of $61 on 25 October. There has been a mild correction in its price but the momentum appeared to be supporting a higher price.
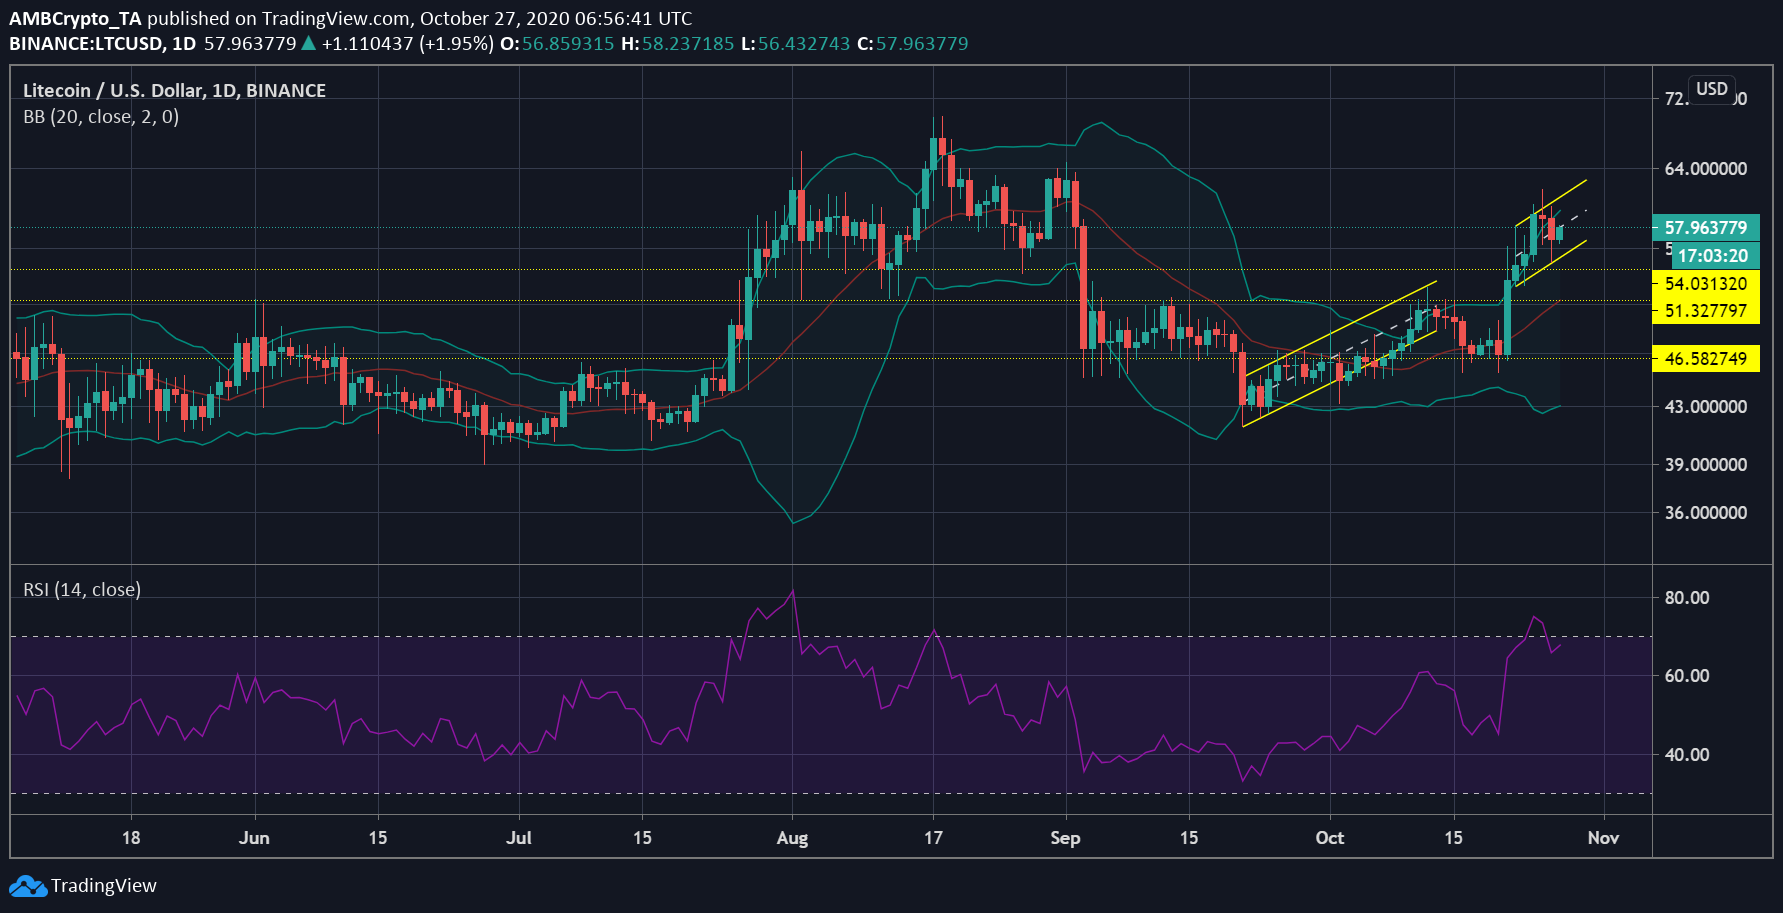
Source: LTC/USD on TradingView
The daily chart of Litecoin suggested that after the 23% surge within a day, LTC price was registering higher highs. These higher highs were forming within an ascending channel that had earlier noted a downward break. Similarly, the current price trend may also result in the price to break lower, even though it was noting a bullish rally presently.
This bullishness was highlighted in the signal line taking a position under the candlesticks, whereas volatility was also high. This volatile market may result in the temporary price of the asset to rise but LTC had already reached an overbought zone, which meant a trend reversal could near. This was highlighted by the Relative Strength Index [RSI] that noted the value cross the 70-level indicating the asset was overbought and immediately sunk following a selling pressure. This minimal selling pressure put the asset back under the overbought zone, but the value has remained close to this zone.

Source: LTC/USD on TradingView
The Fibonacci retracement tool marked the important levels of support and resistance for Litecoin in the given period. Given LTC’s previous consolidation phase, there has been strong immediate support marked at $53.97. The current price has dipped under the support at $57 and is moving towards $53. This has been an important level of LTC as it has been tested four times before, which hints at the potential bounce-back that could follow if the value slumped to this level.