Analysis
Litecoin faces pullback to $43, but re-test of resistance is strong possibility

The 7th-ranked cryptocurrency in the market, Litecoin appeared extremely comfortable around the consolidation range of $43 – $47, at the time of writing. It was priced at $45.68 with a 24-hour trading volume of $1.6 billion.

Source: Coinstats
However, a sense of disruption might soon be brewing on the charts, with the possibility of a new high or a re-test at a familiar low looming large for the crypto-asset’s future.
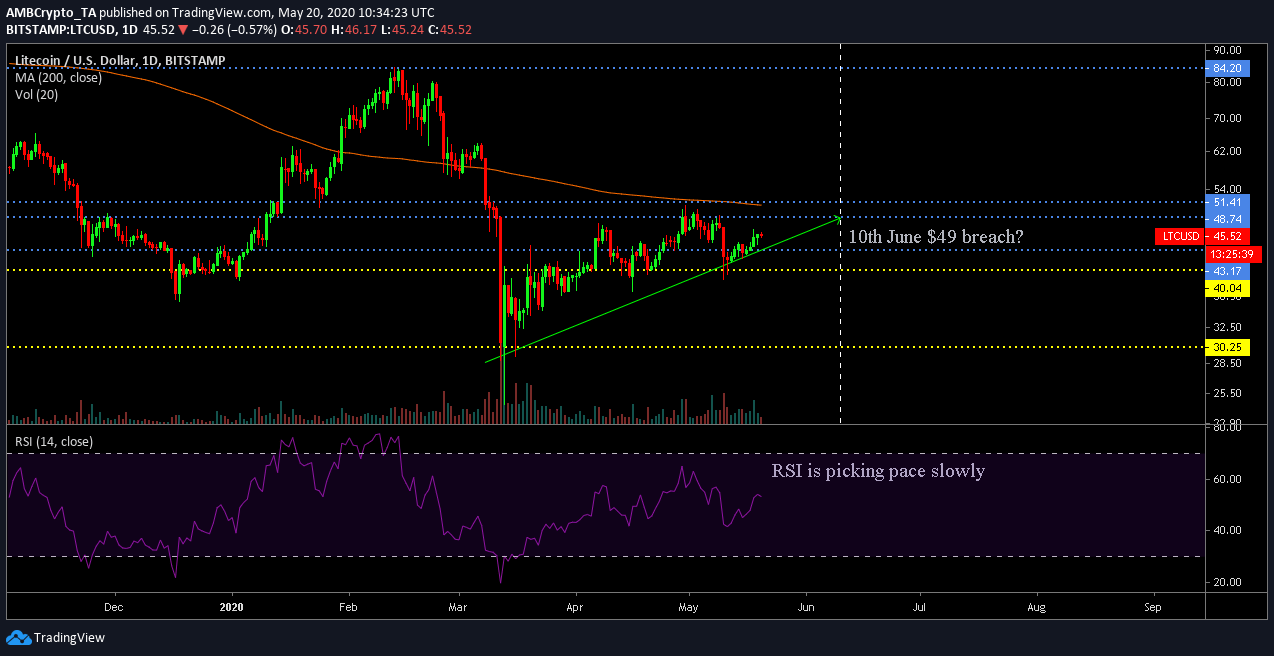
Litecoin 1-day chart

Source: LTC/USD on Trading View
If the long-term chart of Litecoin is closely observed, it can be seen that the crypto-asset has been on an incline at a relatively steady pace. After the timely corrections on 9 May, Litecoin practically strengthened its local bottom at $40. Hence, a possible breach below this range is unlikely in the near future.
Considering Litecoin adheres to the uptrend (green line), there is a possibility that the crypto-asset will test resistance at $49 by the 2nd week of June. However, the strong resistance implied by the 200-moving average may play a strong role as well. As mentioned above, a strong sideways movement was also evident between $43 and $47.
Further, the Relative Strength Index or RSI also noted an influx in buying pressure, but a clear upper hand was not demonstrated by the buyers.
Litecoin 4-hour chart
Source: LTC/USD on TradingView
Now, the steady levels highlighted on the long-term chart were not identified in the short-term readings. According to the analysis, Litecoin registered a strong resistance at $46 and it is most likely to re-test immediate support at $44.04. Now, the formation of a rising wedge pattern increases the chances of a bullish breakout, but the price should not tumble below the support at $43.
The VPVR suggested that Litecoin was mediating a range backed by low trading volume. Hence, the trading time price is possibly a temporary valuation, one that is subject to change within the next 24-48 hours.
Further, the MACD indicated a continuous bullish rally, but the press time close proximity between the signal line and MACD line would raise some concerns for bullish investors. Overall, a panic buy or sell period will not occur anytime soon for the 7th-largest asset, but a minor correction seems likely before its next attempt to test long-term resistance at $48.

