Analysis
Litecoin exhibits ascending channel pattern but moving averages complete bullish crossover

Litecoin was one of the top performers during the bullish surge of April-June. Registering a hike of over 140 percent allowed Bitcoin’s silver counterpart to breach $100 valuation. The asset’s price peaked at over $140 on 21st June but at press time, it was down by almost 50 percent, recording $70.61. Price corrections over the last couple of months have been significant, as the coin continued to navigate in a relative bearish marketplace in comparison to its bullish wave mid-May.
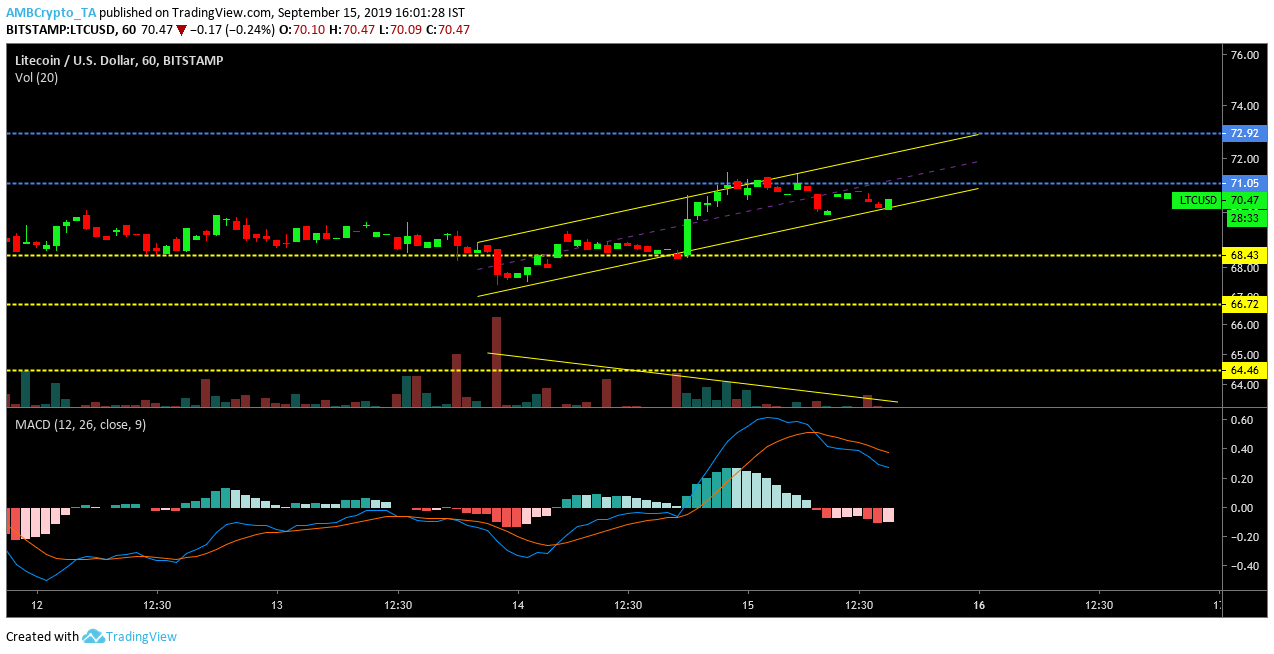
Litecoin 1-hour chart

Source: Trading View
1-hour chart of Litecoin exhibited stagnation in terms of major price activity. Asset’s value consolidated between the resistance of $71.05 and support at $68.43 for a majority of the period. An ascending channel pattern was observed in the charts, indicating a bearish breakout. Strong supports were placed at $68.43 and $66.72 as the breakout was less likely to breach these marks without strong bearish momentum.
The decreasing trade volume suggested a bearish diversion and MACD indicator also remained bearish for Litecoin.
Litecoin 4-hour chart
Source: Trading View
4-hour chart echoed similar traits to the 1-hour trend. An identical ascending channel was observed with strong support placed at $64.36. The trade volume depreciated over time suggesting lack of investors but a major indicator exhibited bullish patterns.
On 10th September, 50-moving average completed a crossover with 100-moving average, suggesting that the bulls are likely to enter the fray soon. However, the pattern indicated a bearish outbreak so the possibility between a bull surge or a bear slump was on equal footing.
In the case of a bullish breakout, considering sufficient momentum, the price should re-test resistance at $71.39 but unlikely to breach $75.74.
A bearish breakout will allow strong supports at $64.31 and $62.21 to aid the silver coin. Litecoin breaching past support at 62.21 would nullify gains acquired during the bull surge of April-June.
Conclusion
Short-term charts for Litecoin pictured bearish patterns but moving average contradicted the predicted trend.

