Litecoin, Cosmos, Dogecoin Price Analysis: 03 December

Bitcoin’s price was quick to record a minor correction after having registered a new ATH a few days ago. Since then, some of the market’s most popular altcoins have had to endure a brief period of price consolidation on the charts. Since the start of December, cryptocurrencies like Litecoin, Cosmos, and Dogecoin have remained stuck between their immediate resistance levels and points of support.
Litecoin [LTC]

Source: LTC/USD, TradingView
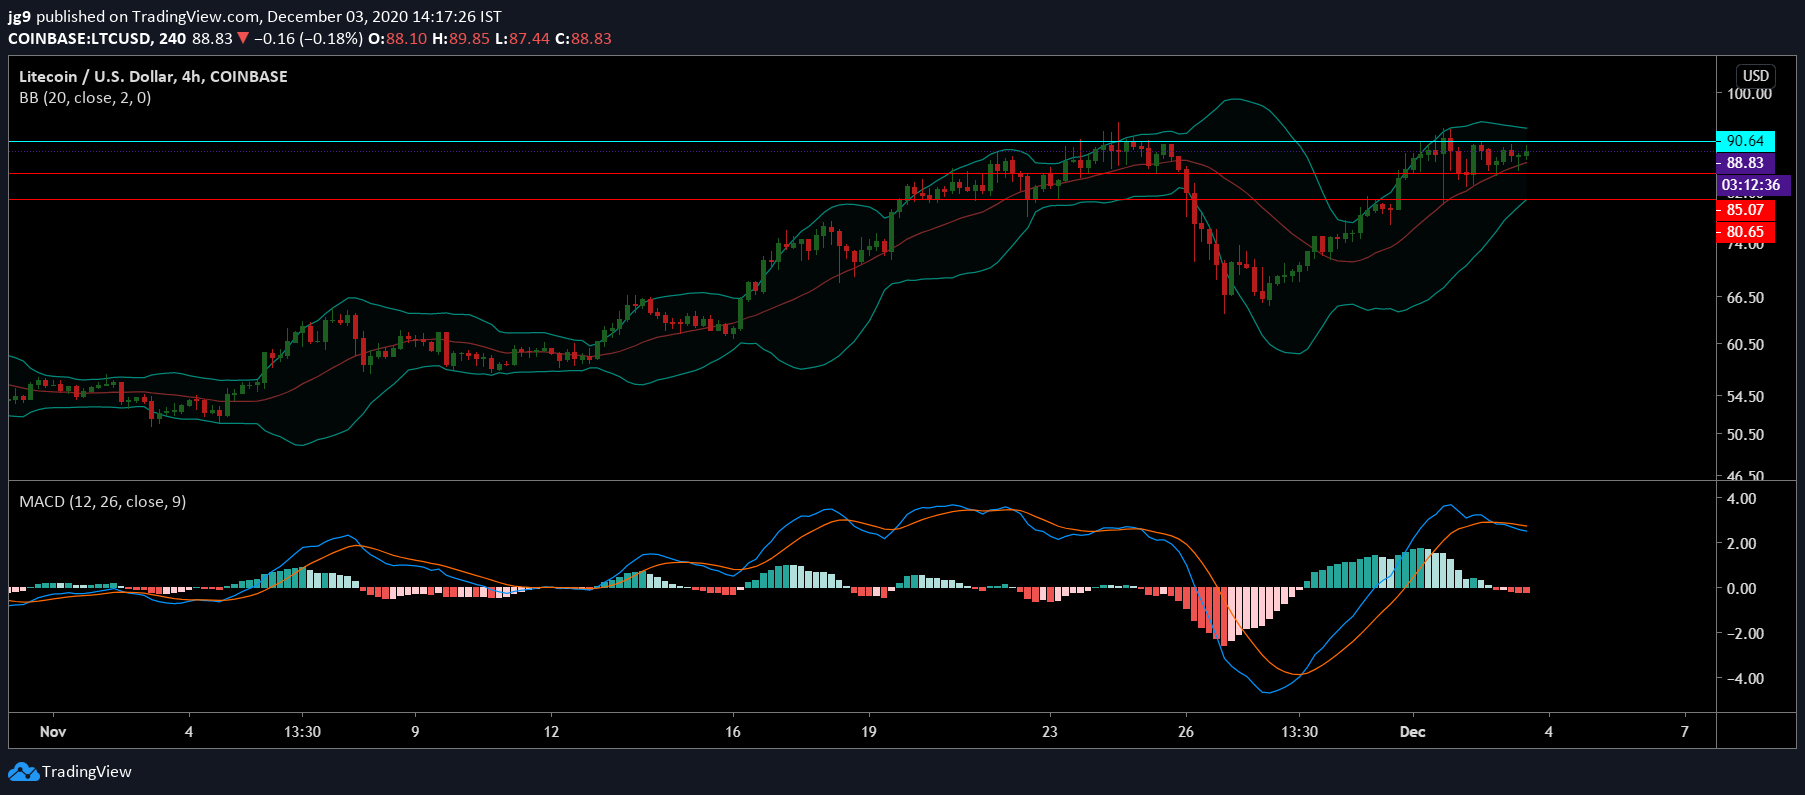
Litecoin, at the time of writing, was being traded at $89.3 with a market cap of $5.8 billion. Over the past 24-hours, the coin’s price fell by over 2.5 percent, having noted a trading volume of $7.3 billion. Since 1 December, Litecoin’s price has been stuck between its immediate support at $85 and its key $90-resistance level. However, if the coin were to drop in valuation, it can also count on the support at $80.
The Bollinger Bands for LTC were continuing to contract, indicating low levels of volatility. The MACD indicator didn’t look very promising after having undergone a bearish crossover.
While Litecoin has been fairly dormant in terms of recent developments, Binance recently announced the launch of LTCUSD Quarterly 1225 & 0326 Coin-margined contracts on its platform.
Cosmos [ATOM]

Source: ATOM/USD, TradingView
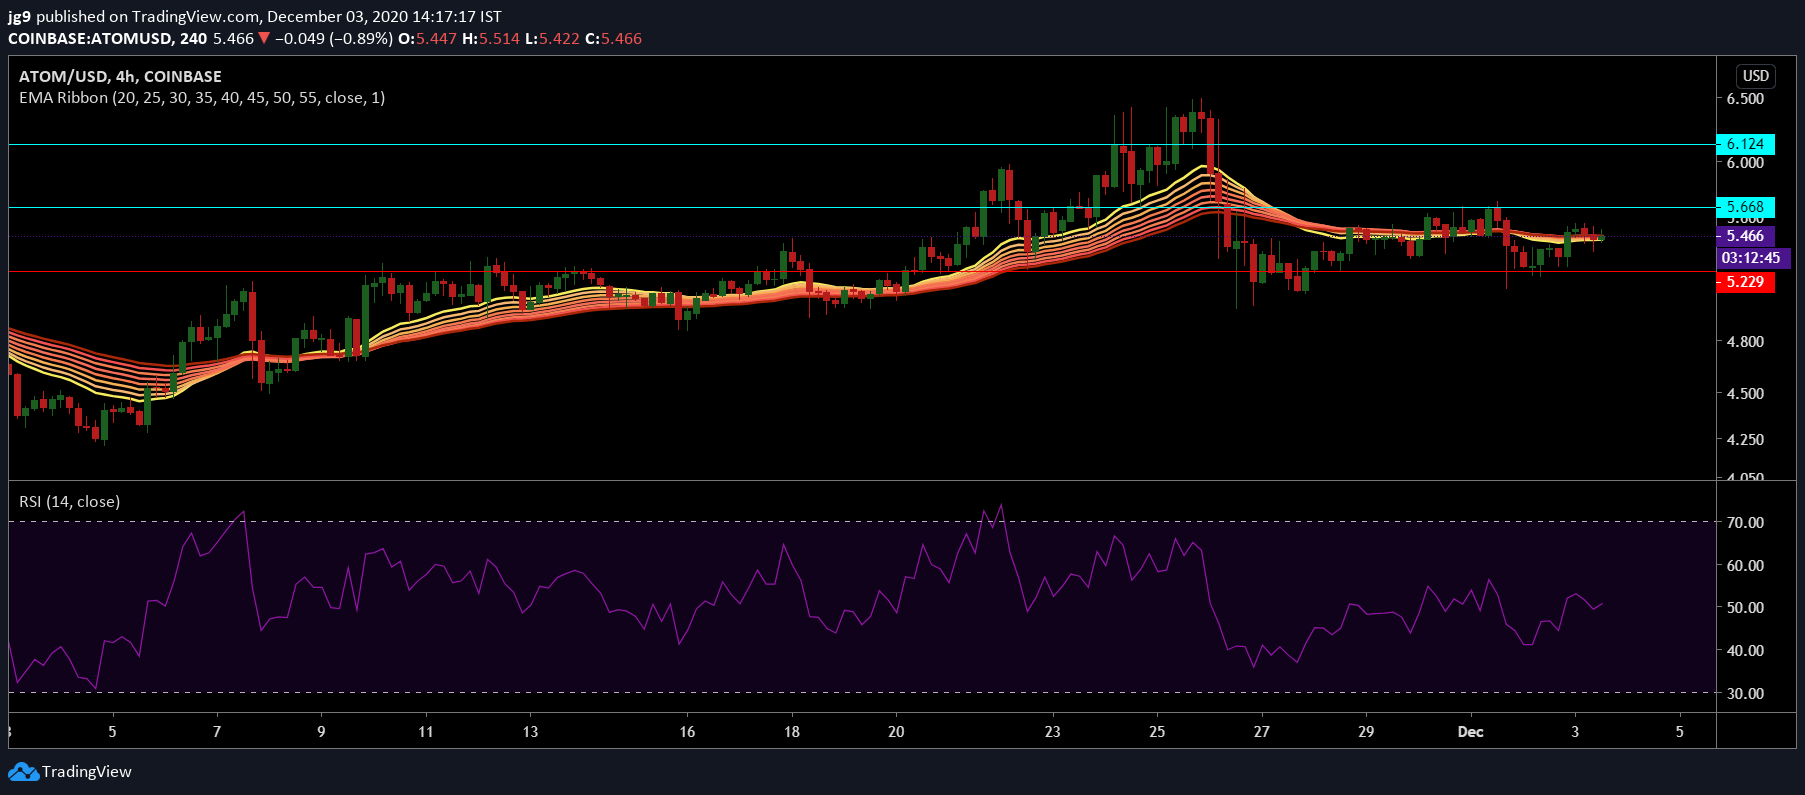
Cosmos was ranked 24th on CoinMarketCap’s list, at press time, with a trading price of $5.4 and a market cap of $1.1 billion. Akin to LTC, Cosmos’s price has also not moved significantly over the past two days. For Cosmos, there were two strong points of resistance at $5.6 and $6.1. If the coin were to see a minor dip, the support at $5.2 may come in handy.
The EMA ribbons, after having settled below the press time trading price, was offering support for the coin. The RSI indicator, after having spent time at the neutral zone, was heading towards the overbought zone.
Dogecoin [DOGE]

Source: DOGE/USD, TradingView
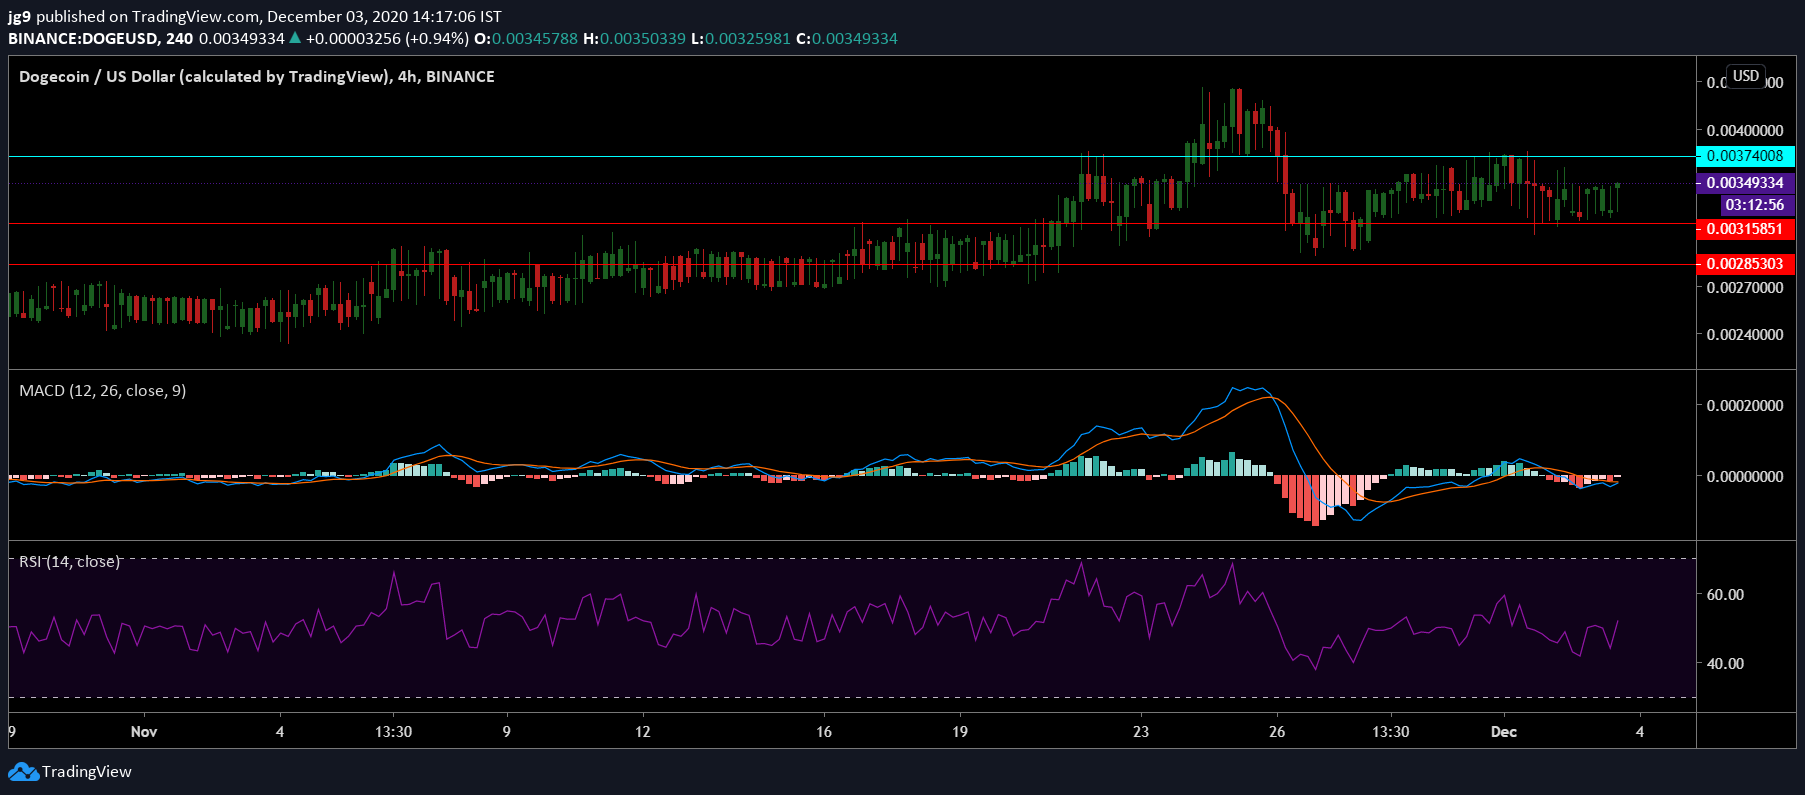
For the crypto-market’s favorite meme-coin, Dogecoin’s price action wasn’t very different. It was trading at $0.0033 with a market cap of $448 million. Dogecoin was likely to face strong resistance at $0.0037 and had two points of support at $0.0031 and $0.0028.
The MACD indicator also underwent a bearish crossover with the Signal line going past the MACD line. However, the RSI indicator continued to remain in the neutral zone, but it may soon head towards the overbought zone.

![Reasons why Litecoin [LTC] investors should be concerned](https://engamb.b-cdn.net/wp-content/uploads/2023/12/ambcrypto_A_Litecoin-themed_scen-400x240.png.webp)


