Analysis
Litecoin bulls could find relief after closure of falling wedge pattern

While the collective crypto market was in the bearish realm, Litecoin was in dire need of a trend reversal as it was still trading $56.43, at the time of writing, after registering a minor surge of 0.24% in the last 24 hours, according to CoinMarketCap. The coin was trading below the $60-level for more than a week, breaching key support levels.
Bullish Prominence
Litecoin 1-week Chart:

Source: LTC/USD on TradingView
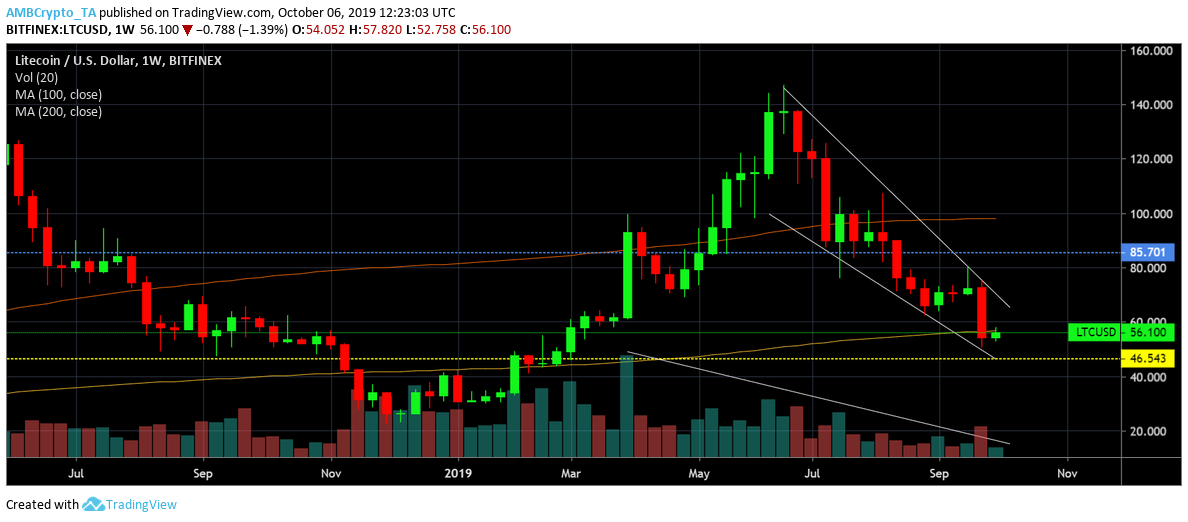
The silver crypto formed a falling wedge pattern on its weekly chart with the price trend following two down-sloping and converging trendlines. This was indicative of a price breakout on the positive side. Further confirming the validity of the pattern was the gradual decline in volume.
The immediate resistance for the coin was found at $85. Except for the first three months, attributing to the crypto winter phase, the price candles were above the 200 moving average. LTC’s price on September 23rd, however, noticed a slump with the candlestick movement falling below the moving average. 100 moving average, which was above that of 200, indicated a bullish trend for the coin, and also acted as a resistance at $98. As LTC continued to struggle above the $56 level, the second support remained untested at $46.24.
Bearish presence
Source: LTC/USD on TradingView
At press time, indicators on the LTC weekly chart, however, exhibited the presence of bearishness in the near term. MACD line was below the signal line suggesting a bearish market for the coin, further RSI line in the oversold zone also pictured a bearish sentiment for the investors of the silver crypto.
Conclusion:
Despite the indicators aligning with the bears, the coin might potentially go for trend reversal as predicted by the formation of a falling wedge which could result in an upward swing in LTC’s price.

