
- Near’s daily transaction has climbed to an all-time high.
- NEAR is currently overbought and might experience a correction.
The daily count of transactions completed on the Near blockchain [NEAR] recently clinched an all-time high of 1.68 million, information retrieved from The Block’s data dashboard showed.
According to the data provider, Near’s daily transaction count observed on a seven-day moving average began its uptrend on 16th October, to have increased by 30% as of this writing.
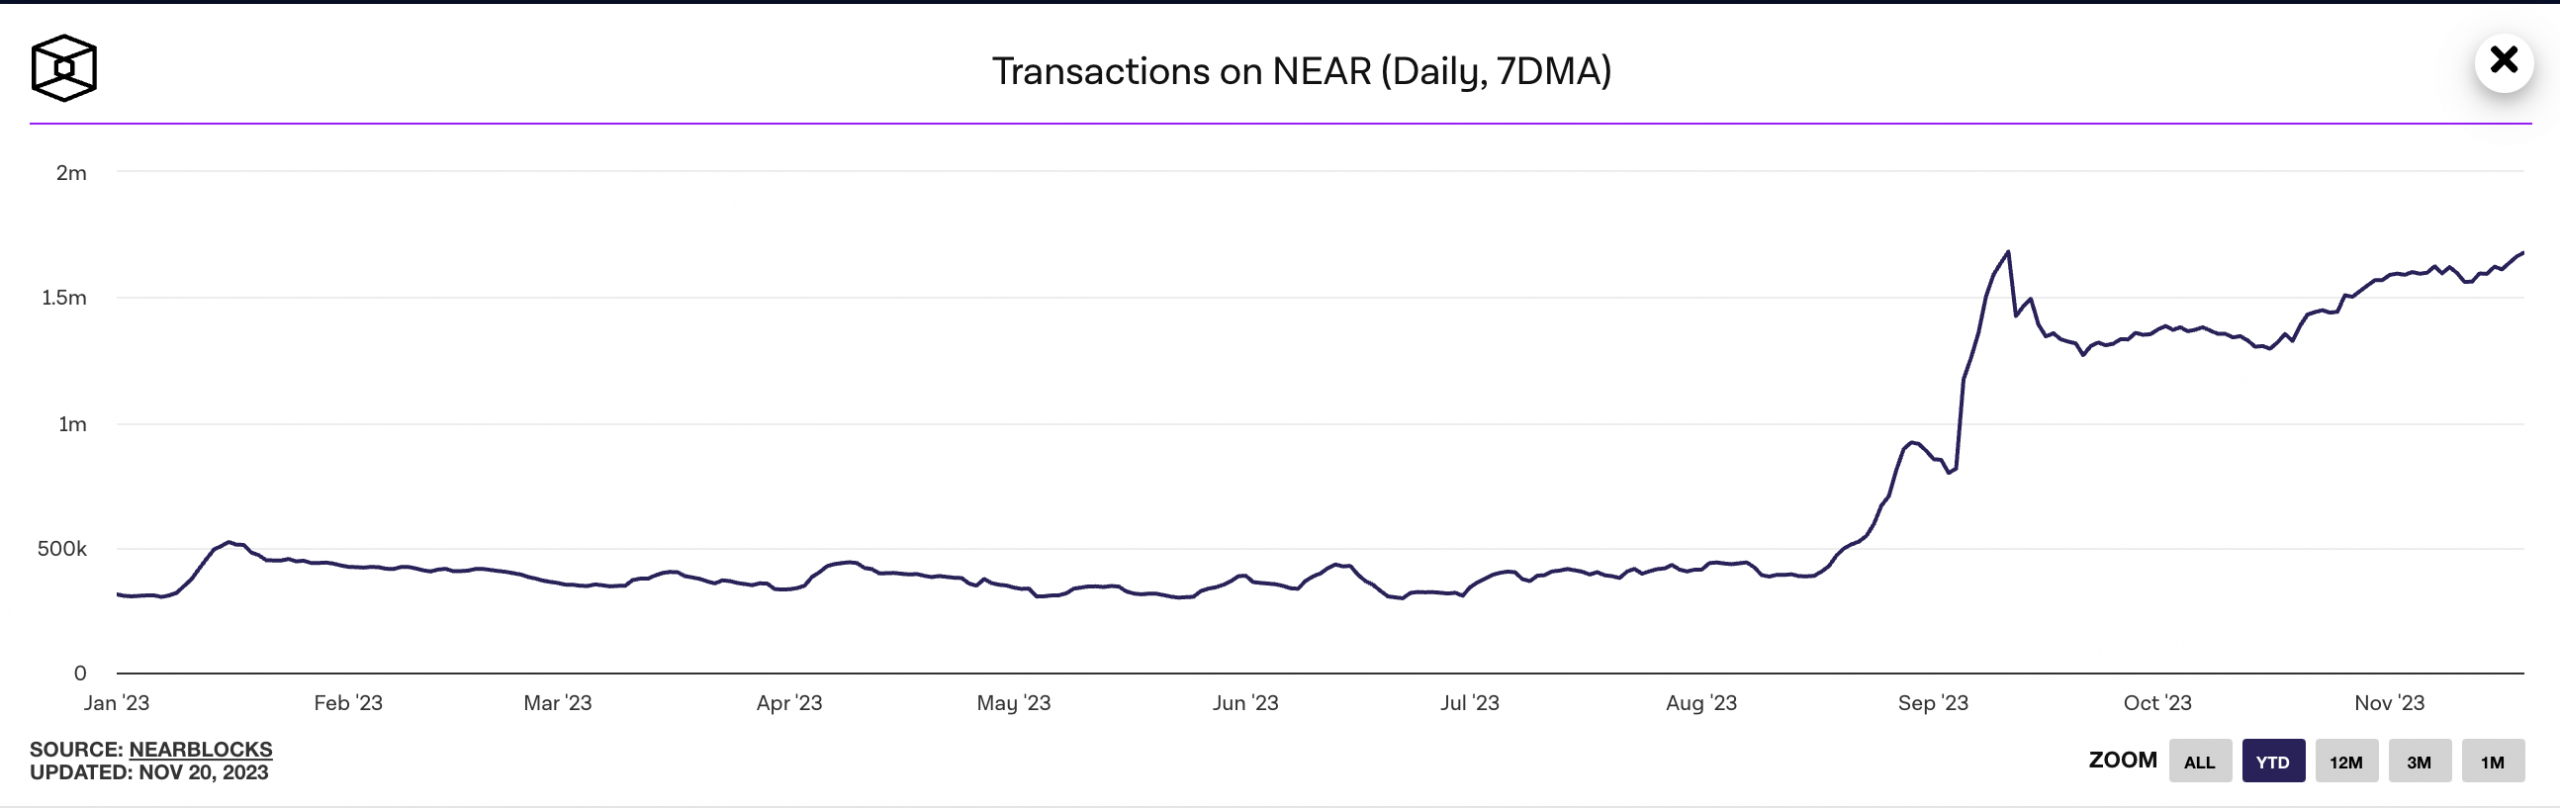
Source: The Block
The recent surge in daily transactions was due to an uptick in the demand for Near in the past few weeks.
Per Artemis, the daily count of unique wallet addresses that completed at least one transaction on Near rallied by 13% between 21st October and 19th November.
The increased demand for Near also impacted the protocol’s decentralized finance (DeFi) vertical. According to data from DefiLlama, the chain’s total value locked (TVL) witnessed a 21% growth in the last week and a 50% surge in the last month.
State of NEAR
As of this writing, the protocol’s native coin exchanged hands at $1.92. Logging an 89% price growth in the last month, the coin last traded at this high in April, data from CoinMarketCap showed.
Interestingly, while the general market has traded sideways due to profit-taking activity after an extended period of price rally, NEAR accumulation has continued to grow.
Key momentum indicators observed on a 24-hour chart showed that NEAR traders continue to favor coin accumulation over distribution. At press time, the alt’s Relative Strength Index (RSI) was 69.44, while its Money Flow Index (MFI) was 67.15.
The values of these indicators showed that buying continues to outpace selling in the NEAR spot market.
Also, NEAR’s Aroon Up Line (orange), spotted at a high of 82.86%, confirmed the strength of the current uptrend. This indicator is used to identify trend strength and potential trend reversal points in an asset’s price movement.
When the Aroon Up line is close to 100, it indicates that the uptrend is strong.
Read NEAR Protocol’s [NEAR] Price Prediction 2023-24
However, at press time NEAR’s price traded above the upper band of its Bollinger Bands (BB) indicator.
This signaled that the market may be overheated. Reversals are common at this point as buyers typically find it challenging to sustain the price rally.
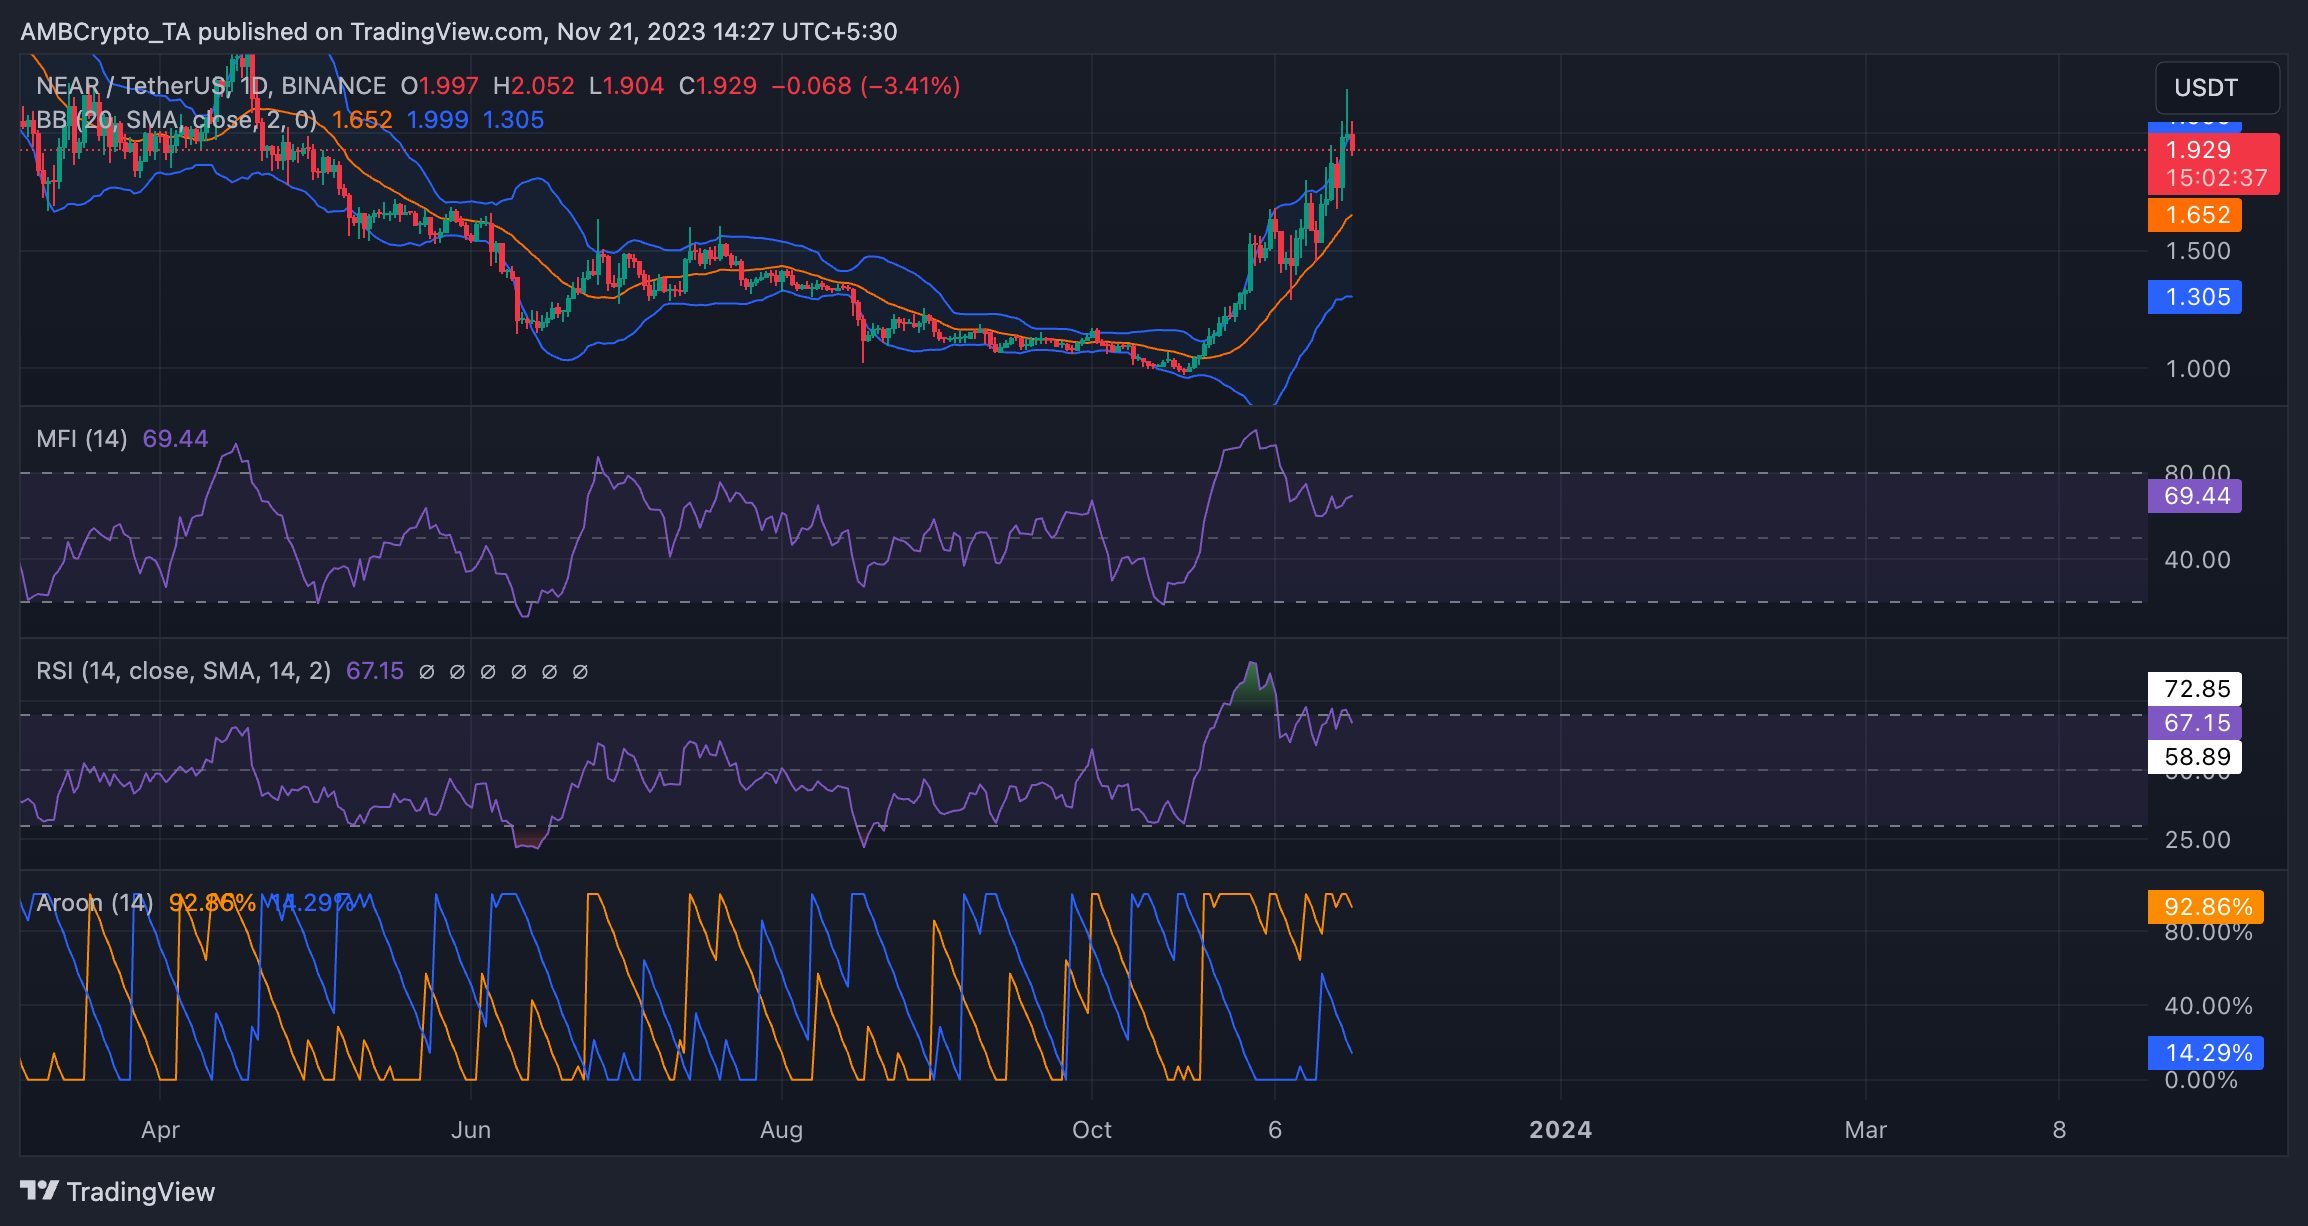
Source: NEAR/USDT on TradingView