
- Ethereum’s active addresses and new addresses spiked in the last 24 hours.
- ETH maintained the $2,000 price range despite its decline.
Of late, Ethereum [ETH] has faced challenges in sustaining its price at the $2,000 mark. But over the last 24 hours, a specific on-chain metric has shown increased activity, signaling a rise in interest.
Activity in Ethereum’s 24-hour address
According to a recent report by Santiment, Ethereum has experienced an increase in its 24-hour active addresses. This marked the second occurrence of such a trend within the same month.
The chart revealed that around the 10th of November, the 24-hour active addresses peaked at nearly 460,000. As of this writing, the figure was around 444,000.
Before these upswings, the last notable activity was observed around September, with over 1 million active addresses recorded.
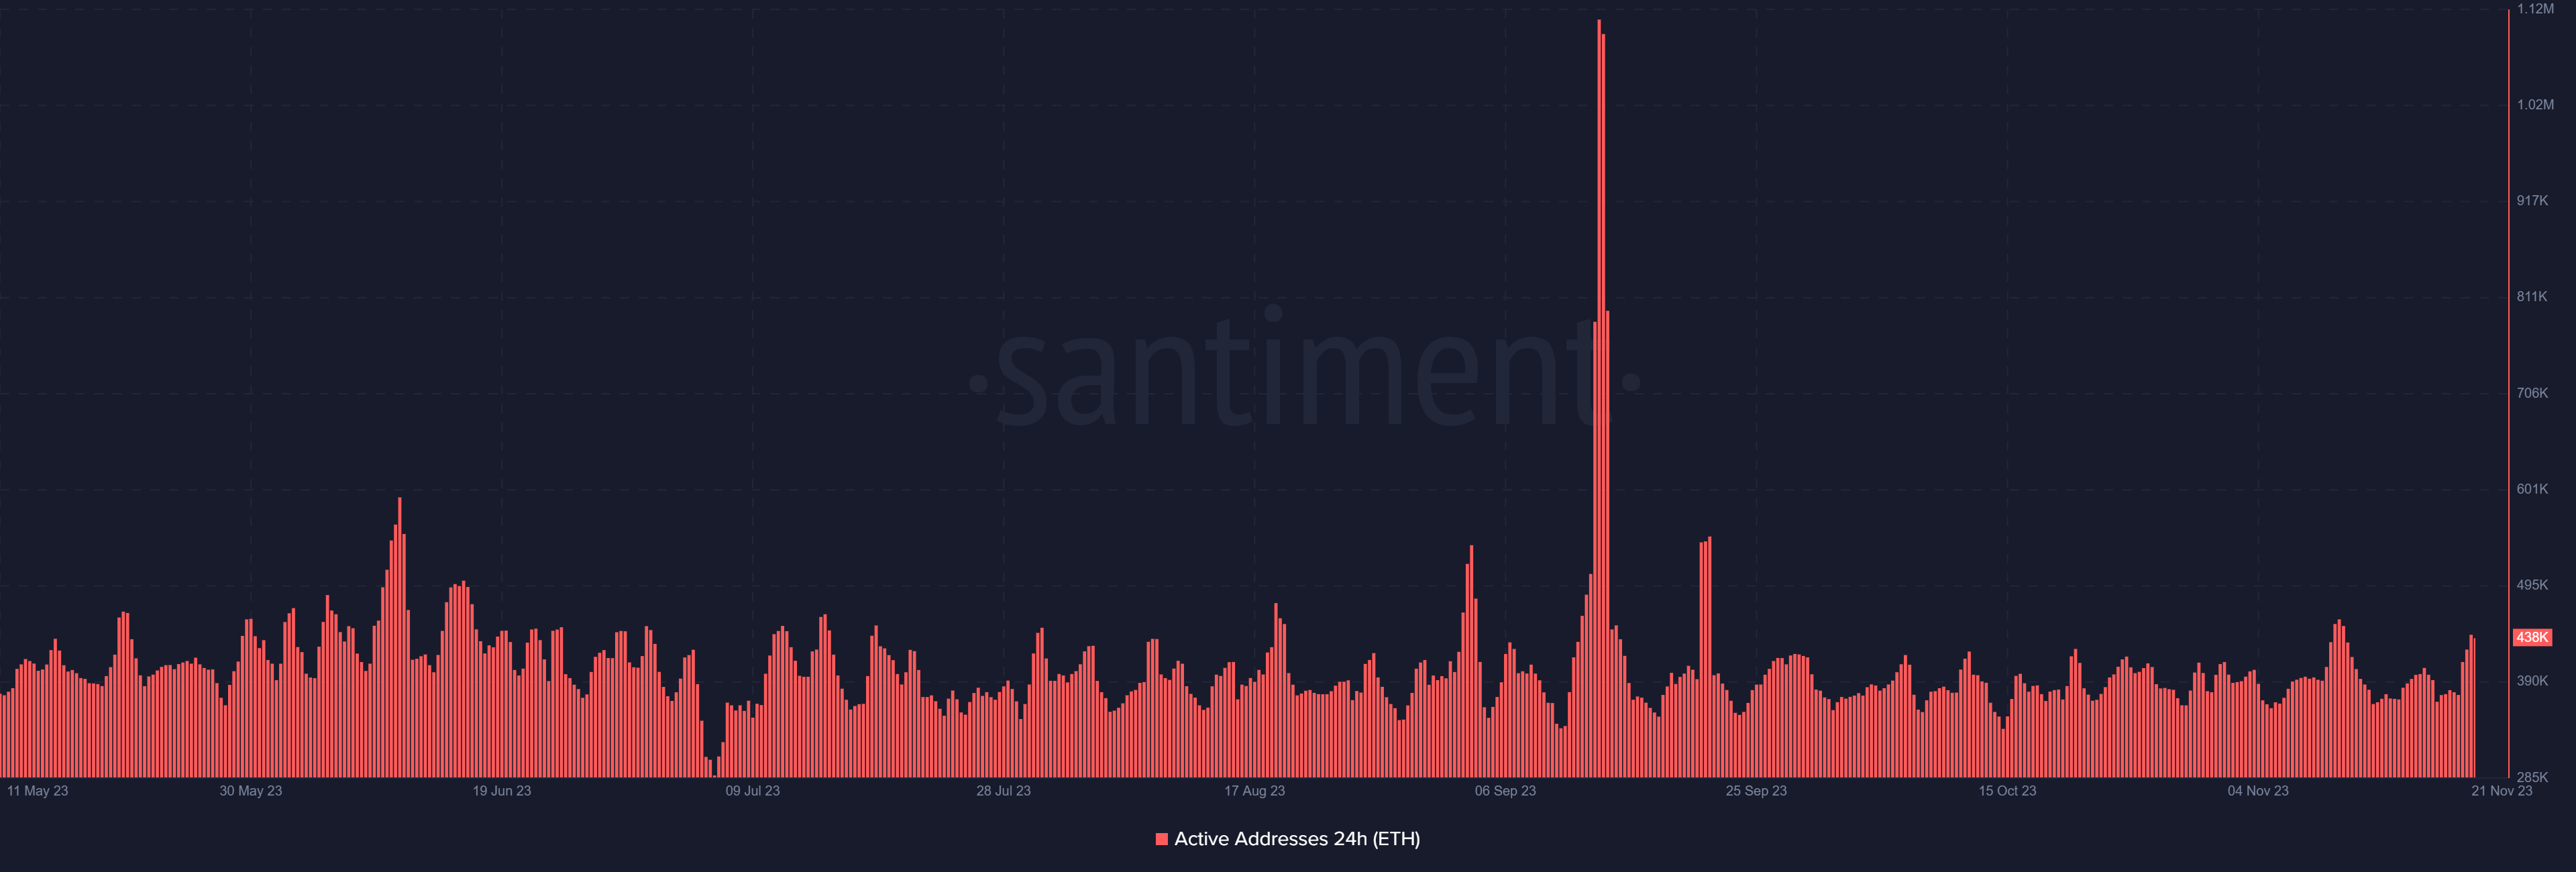
Source: Santiment
New addresses spike to the highest level in months
An in-depth examination showed that not only active addresses were increasing. AMBCrypto’s analysis showed a significant rise in new addresses on the Ethereum network.
As of this writing, the chart on Glassnode showed that more than 94,000 new addresses have been added to the network.
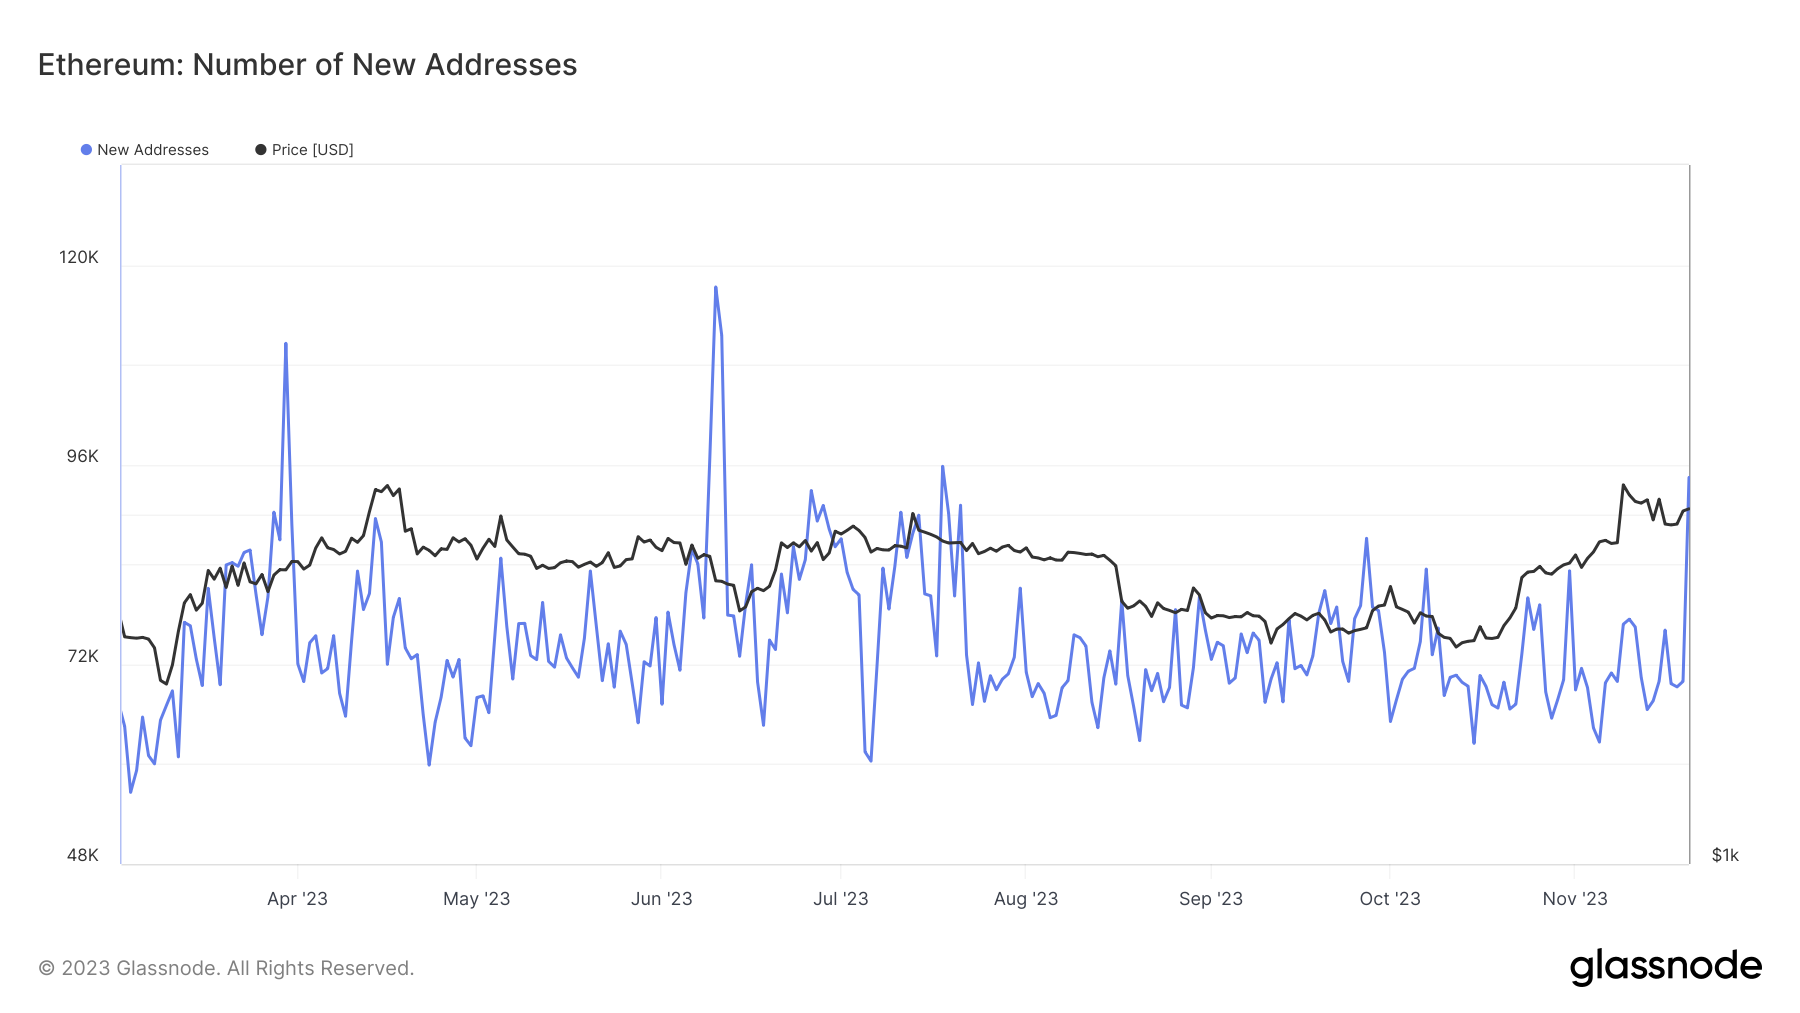
Source: Glassnode
Further analysis of the chart revealed that the last time such a daily number was recorded was around July. The simultaneous increase in both new and active addresses signifies a growth in network activity, potentially positively impacting the price.
ETH maintains its trend
The surge in new and active addresses prompted examining how Ethereum’s Supply on Exchanges reacted. This also offered insights into potential price expectations.
As of this writing, the Supply on Exchanges was around 10.6 million, representing 8.3% of the total supply as of the time of this writing.
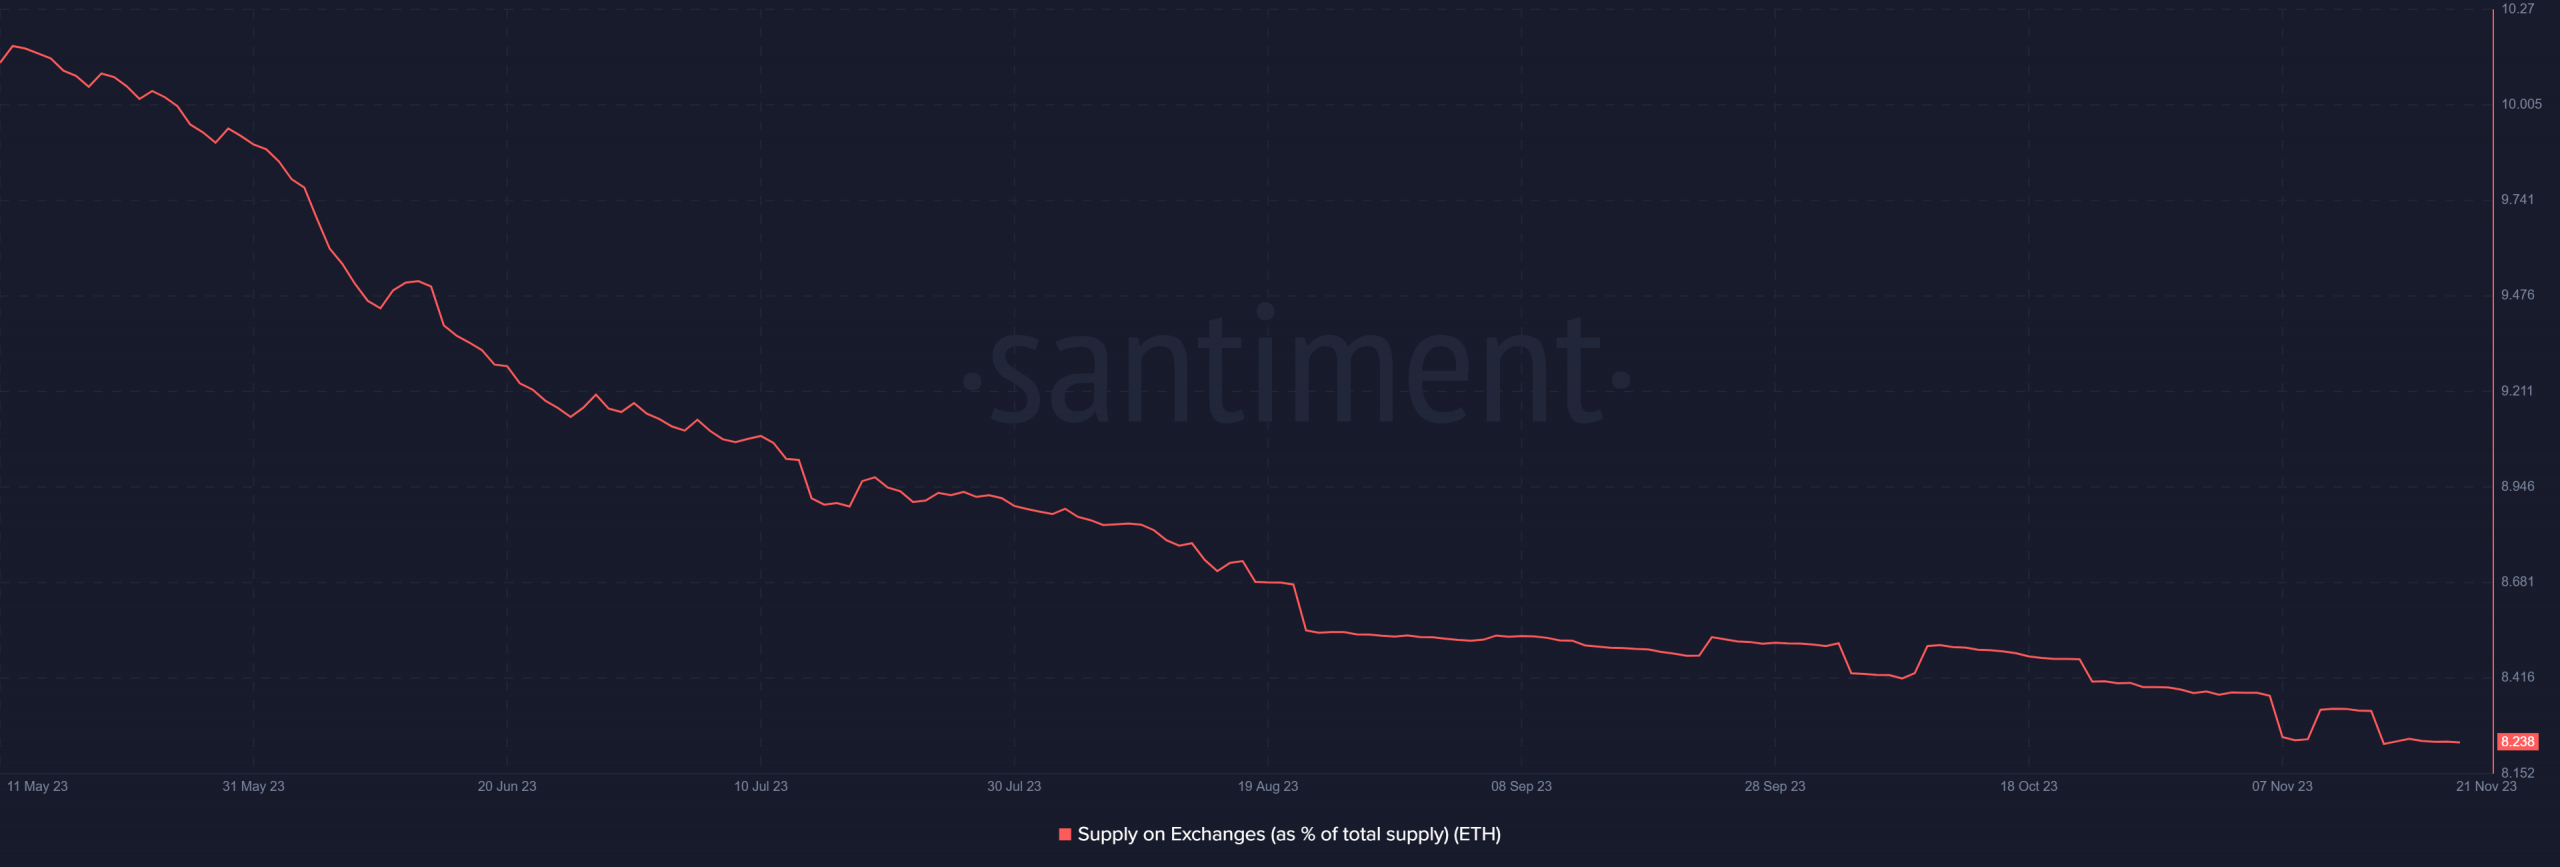
Source: Santiment
Also, a detailed analysis of the chart revealed that despite the increase in the number of addresses, ETH’s Supply on Exchanges remained the same. This implied that the holders of these addresses are not offloading their ETH holdings onto exchanges.
Consequently, this lack of selling pressure is conducive to maintaining price stability for Ethereum.
How ETH is trending
As of this writing, the daily price trend chart showed that Ethereum was teetering on the edge of the $2,000 price range. While trading at a loss of just under 1%, it managed to remain within the $2,000 range.
Realistic or not, here’s ETH market cap in BTC’s terms
Notably, the chart revealed slight upward movements over the past few days.
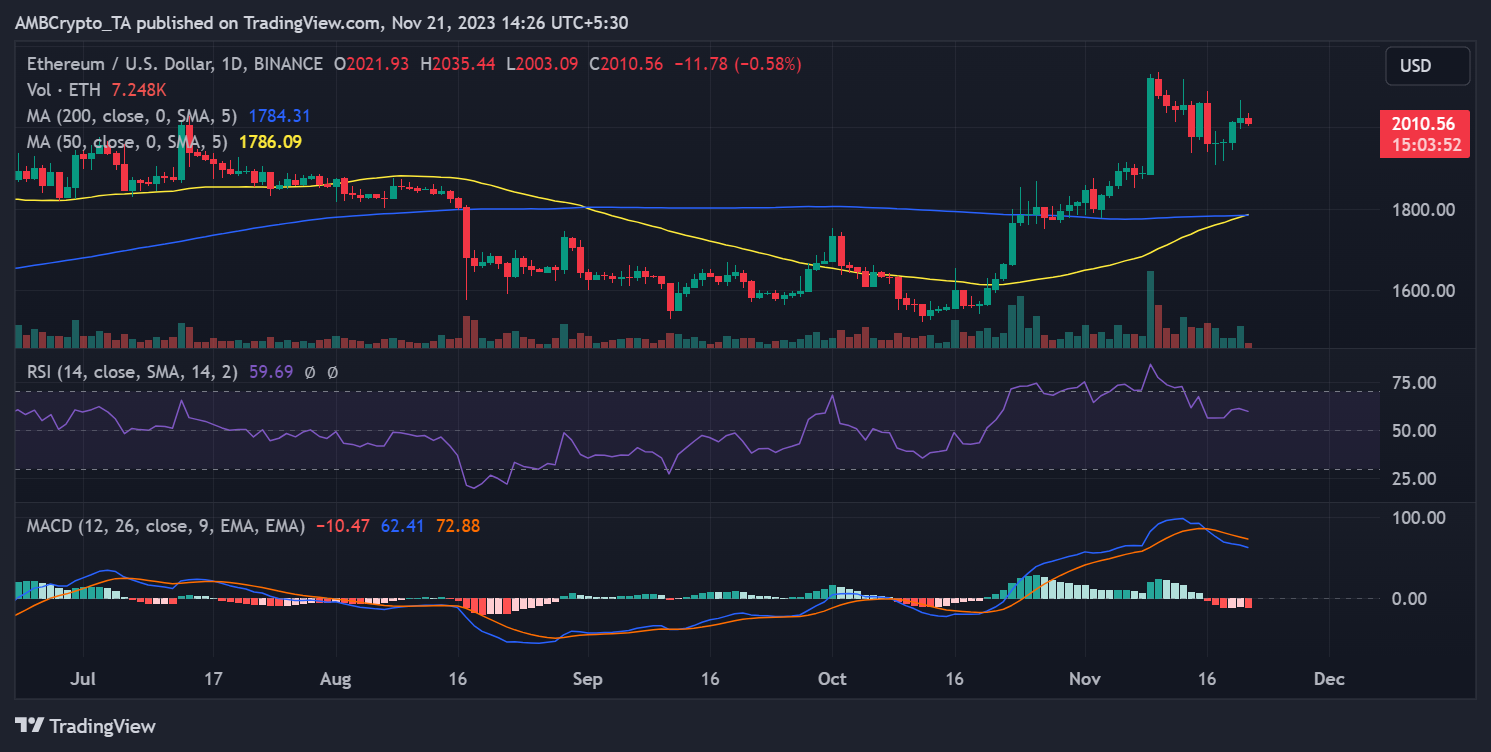
Source: TradingView
Additionally, despite the marginal price decline, there was a noteworthy occurrence of a golden cross. This phenomenon occurs when the short moving average (yellow line) crosses over the long moving average (blue line), typically signaling a positive price trend initiation.