
- MATIC was down by more than 20% in the last seven days.
- Selling pressure on the token was high, and indicators looked bearish.
Polygon [MATIC] investors had a rough ride in the last week as the token’s price dropped by double-digits. However, things could get even worse for investors, as a bearish pattern formed on MATIC’s chart at press time.
Polygon’s price is sinking
CoinMarketCap’s data revealed that MATIC’s price dropped by more than 20% over the last week. In fact, the token was down by over 5% in just the last 24 hours. At the time of writing, MATIC was trading at $0.7563 with a market capitalization of over $7 billion.
Ali, a popular crypto analyst, recently pointed out in a tweet that a bearish pattern had formed in Polygon’s chart.
#Polygon | It looks like $MATIC formed a head-and-shoulders on its 4-hour chart!
A sustained candlestick close below the pattern's neckline at $0.79 could trigger a 16% correction toward $0.67. Invalidation of the bearish outlook comes with an upswing above the right shoulder… pic.twitter.com/doA2ECdVtH
— Ali (@ali_charts) November 21, 2023
As per the tweet, MATIC formed a head-and-shoulders on its 4-hour chart. A sustained candlestick close below the pattern’s neckline at $0.79 could trigger a 16% correction toward $0.67.
However, if things fall into place, MATIC’s price will go up again after the downtrend in the short term.
AMBCrypto took a look at MATIC’s liquidation heatmap to better understand at what moment investors chose to sell. According to our analysis, Polygon’s liquidation increased substantially on the 20th of November, when the token’s price reached $0.86.
This triggered a price correction, the effects of which were still visible at press time.
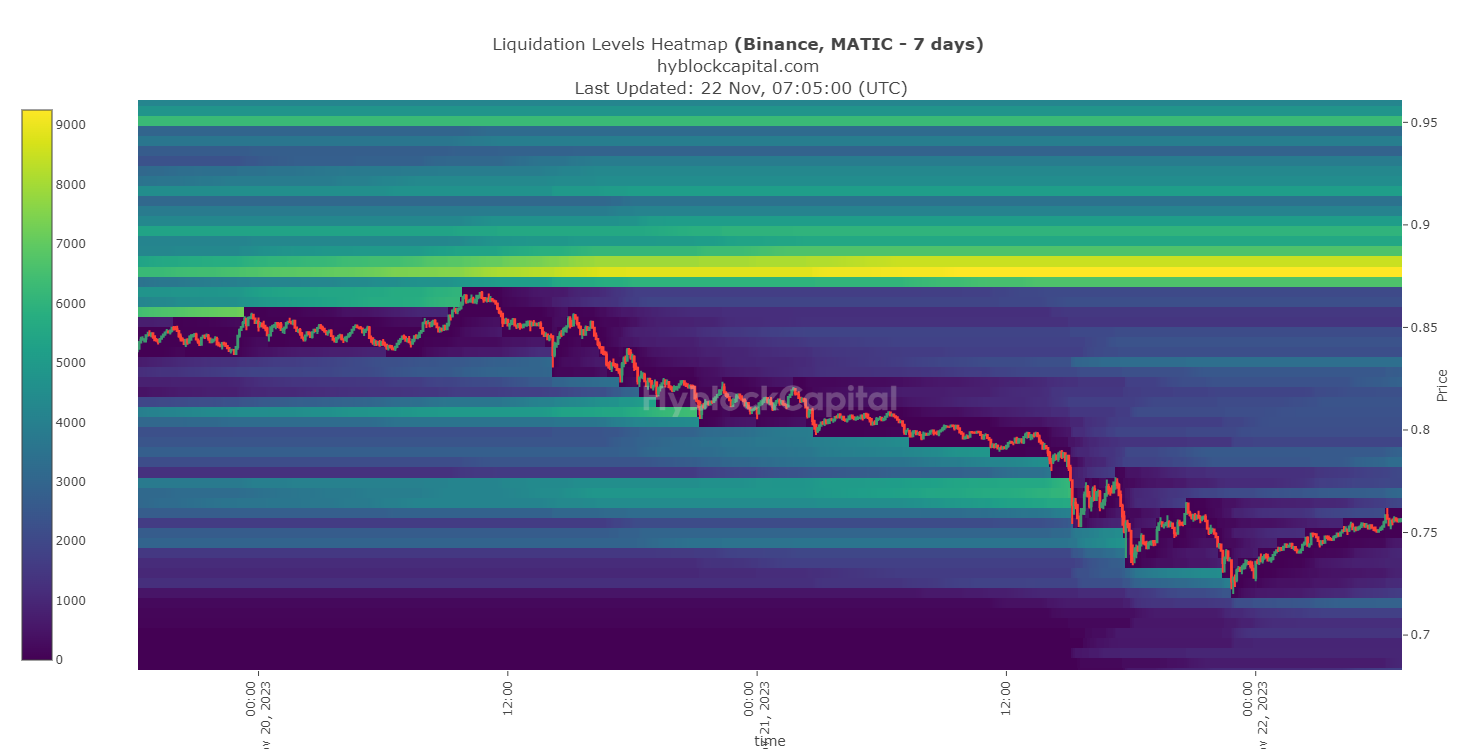
Source: Hyblock Capital
Upon further assessment, AMBCrypto found that MATIC’s Supply on Exchanges spiked last week, while its Supply outside of Exchanges plummeted. This clearly hinted at higher selling pressure on the token.
Not only that, but whales’ confidence in Polygon also dwindled, as evident from the drop in its supply held by top addresses.
Negative sentiment around the token also increased in the last few days, which could be attributed to its bearish price action. Another bearish metric was Polygon’s MVRV Ratio, which sank as well.
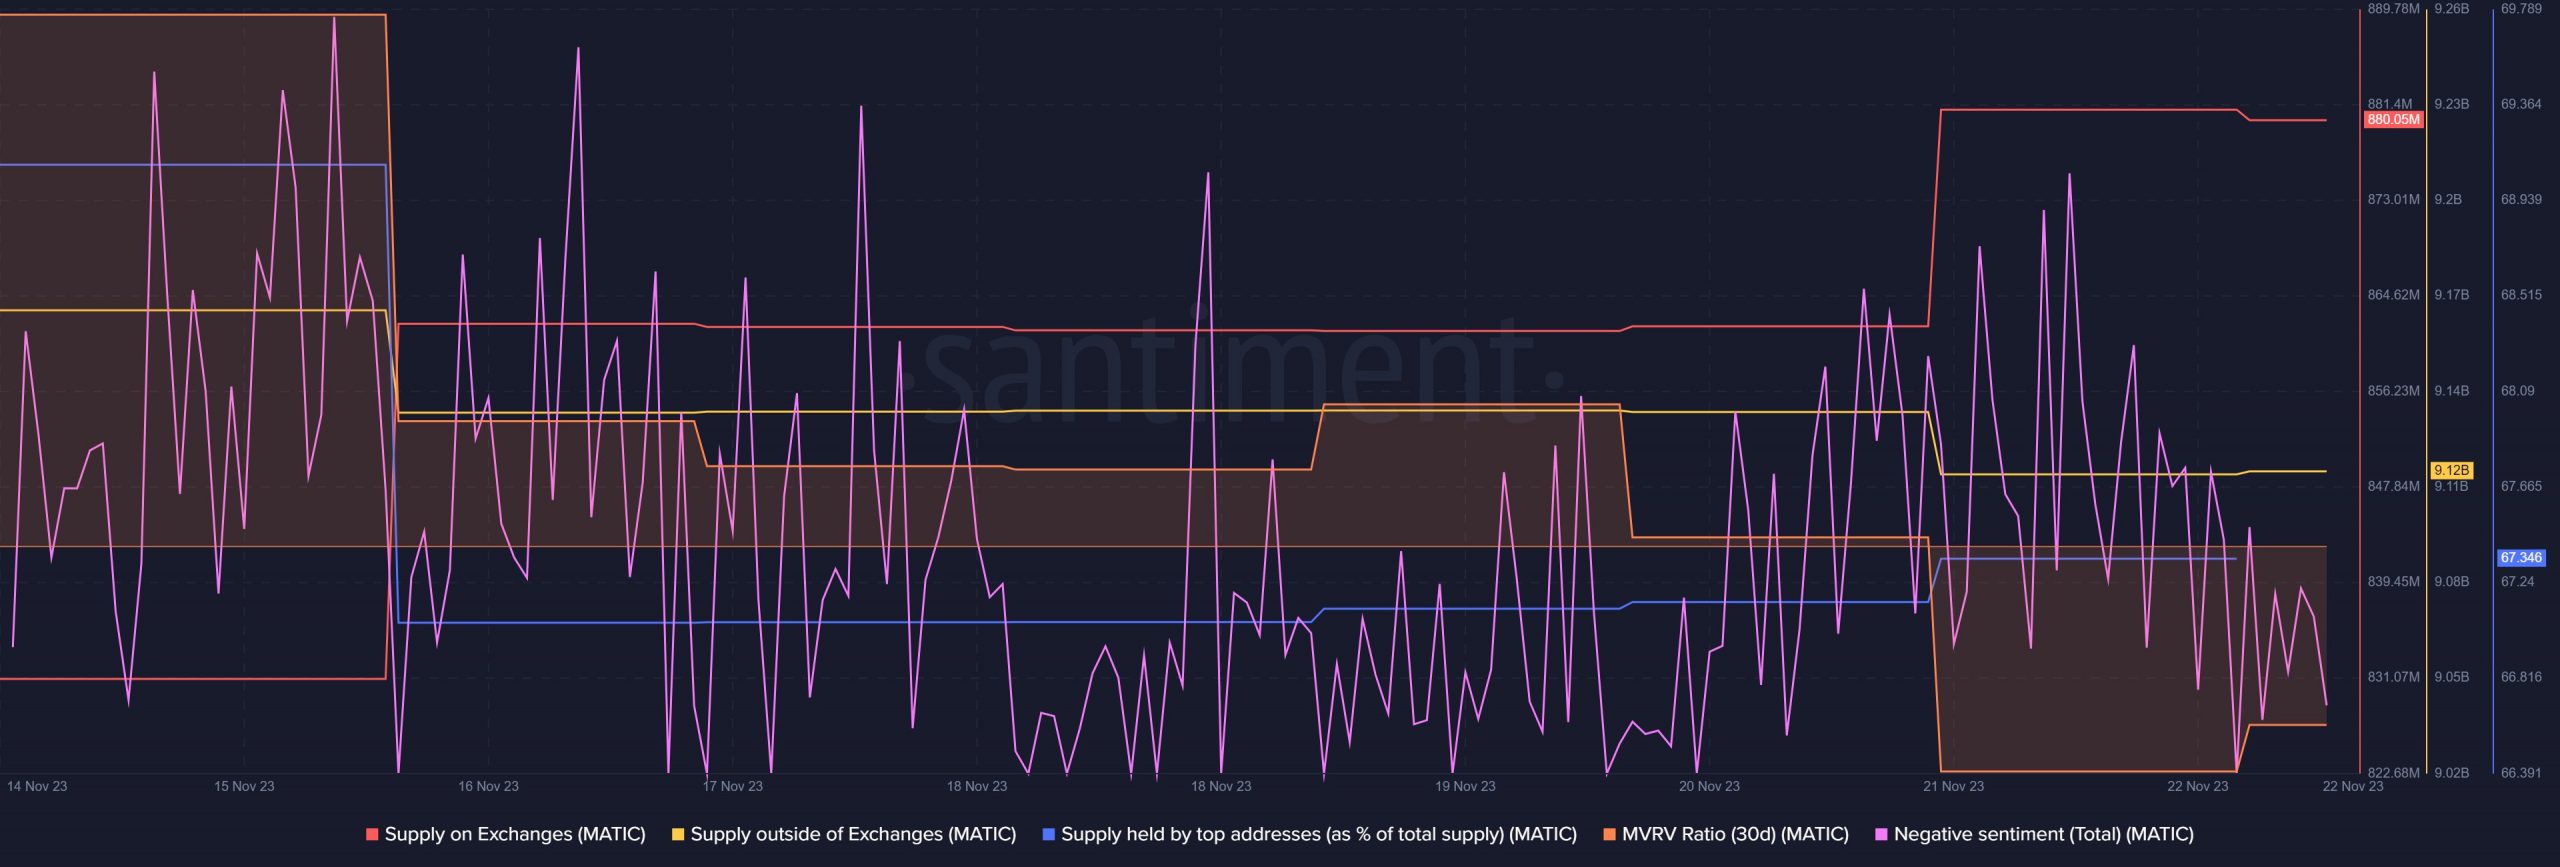
Source: Santiment
Is a further downtrend likely?
AMBCrypto’s analysis of MATIC’s daily chart pointed out that its MACD displayed a bearish crossover. The token’s price was entering a less volatile zone, minimizing the chances of an unprecedented price surge in the near term.
Nonetheless, MATIC’s Relative Strength Index (RSI) and Chaikin Money Flow (CMF) both registered upticks — a sign of a trend reversal.
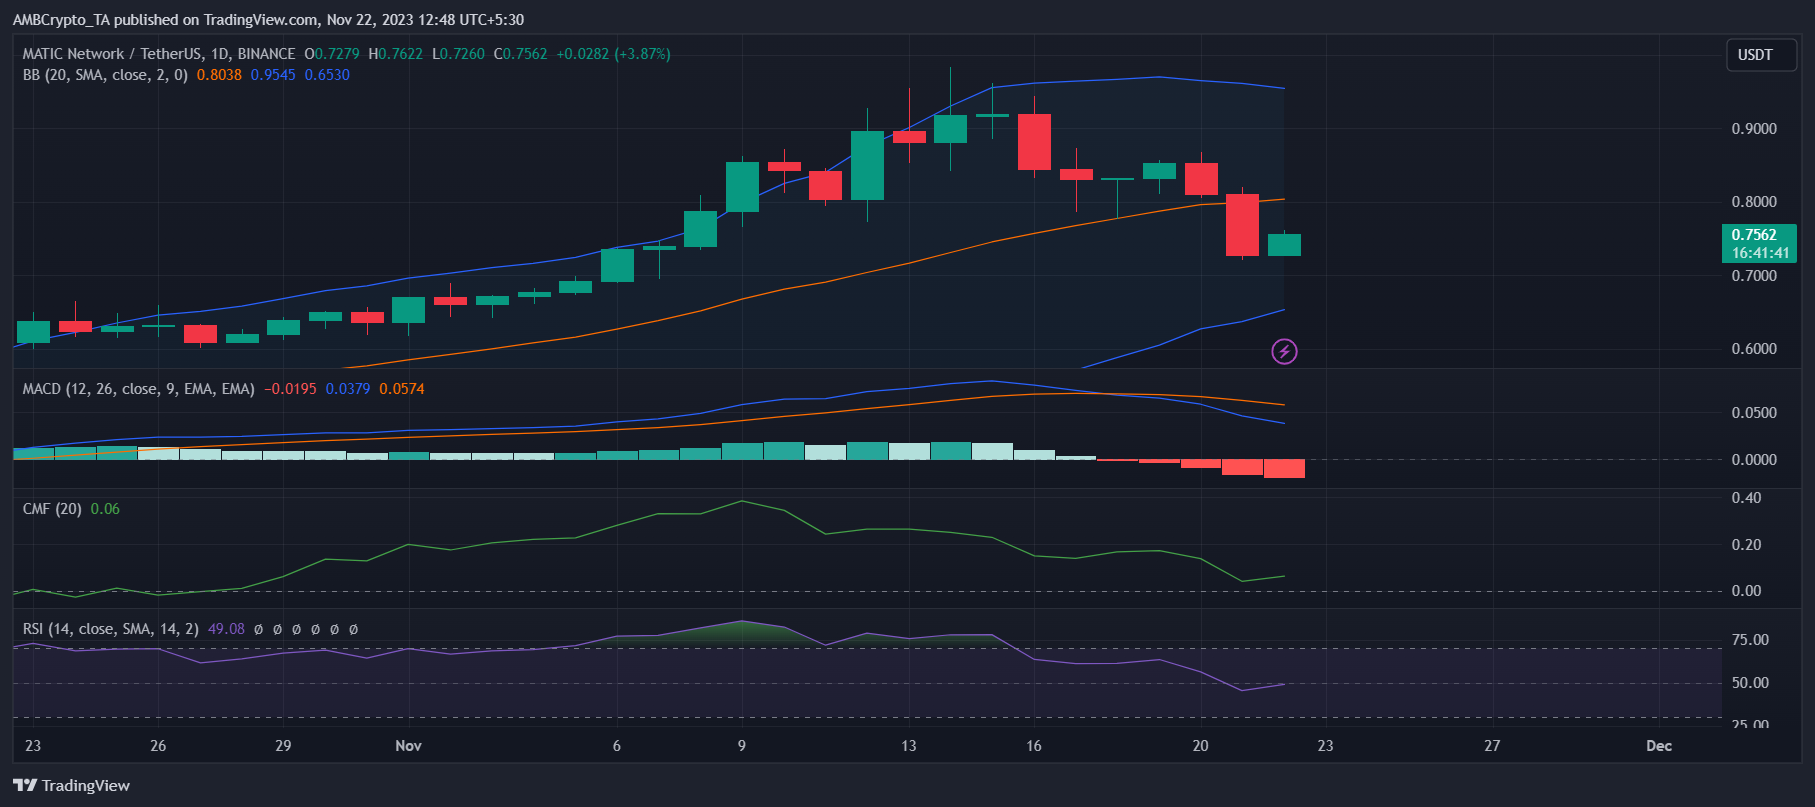
Source: TradingView
Is your portfolio green? Check out the MATIC Profit Calculator
Polygon has another trick up its sleeve, which could also help turn the situation around in the token’s favor. Polygon had earlier announced its plan for Polygon 2.0, in which MATIC will be upgraded to a new POL token.
The process has already been initiated on Ethereum [ETH] mainnet. Once completed, it could be a game-changer for the token.
The POL token upgrade is now live on Ethereum mainnet.
Polygon 2.0, released this summer, is a roadmap for scaling Ethereum to build the Value Layer of the Internet. POL unlocks that future.
POL is a next-generation token that can power a vast ecosystem of ZK-based L2 chains.… pic.twitter.com/gmrsu0ZqLz
— Polygon (Labs) (@0xPolygonLabs) October 25, 2023