Analysis
Ethereum’s price prepping for positive breakout with pennant formation

Ethereum was trading below $150 at press time, following the latest downtrend in the crypto-market. According to data from CoinMarketCap, the coin had fallen by 17.58% over the past week and was priced at $145.72, at press time, registering a market cap of $15.83 billion. While ETH has been in the bearish realm for quite some time now, price recovery, following a minor surge, could be on the horizon.
ETH 1-Hour Chart

Source: ETH/USD on TradingView
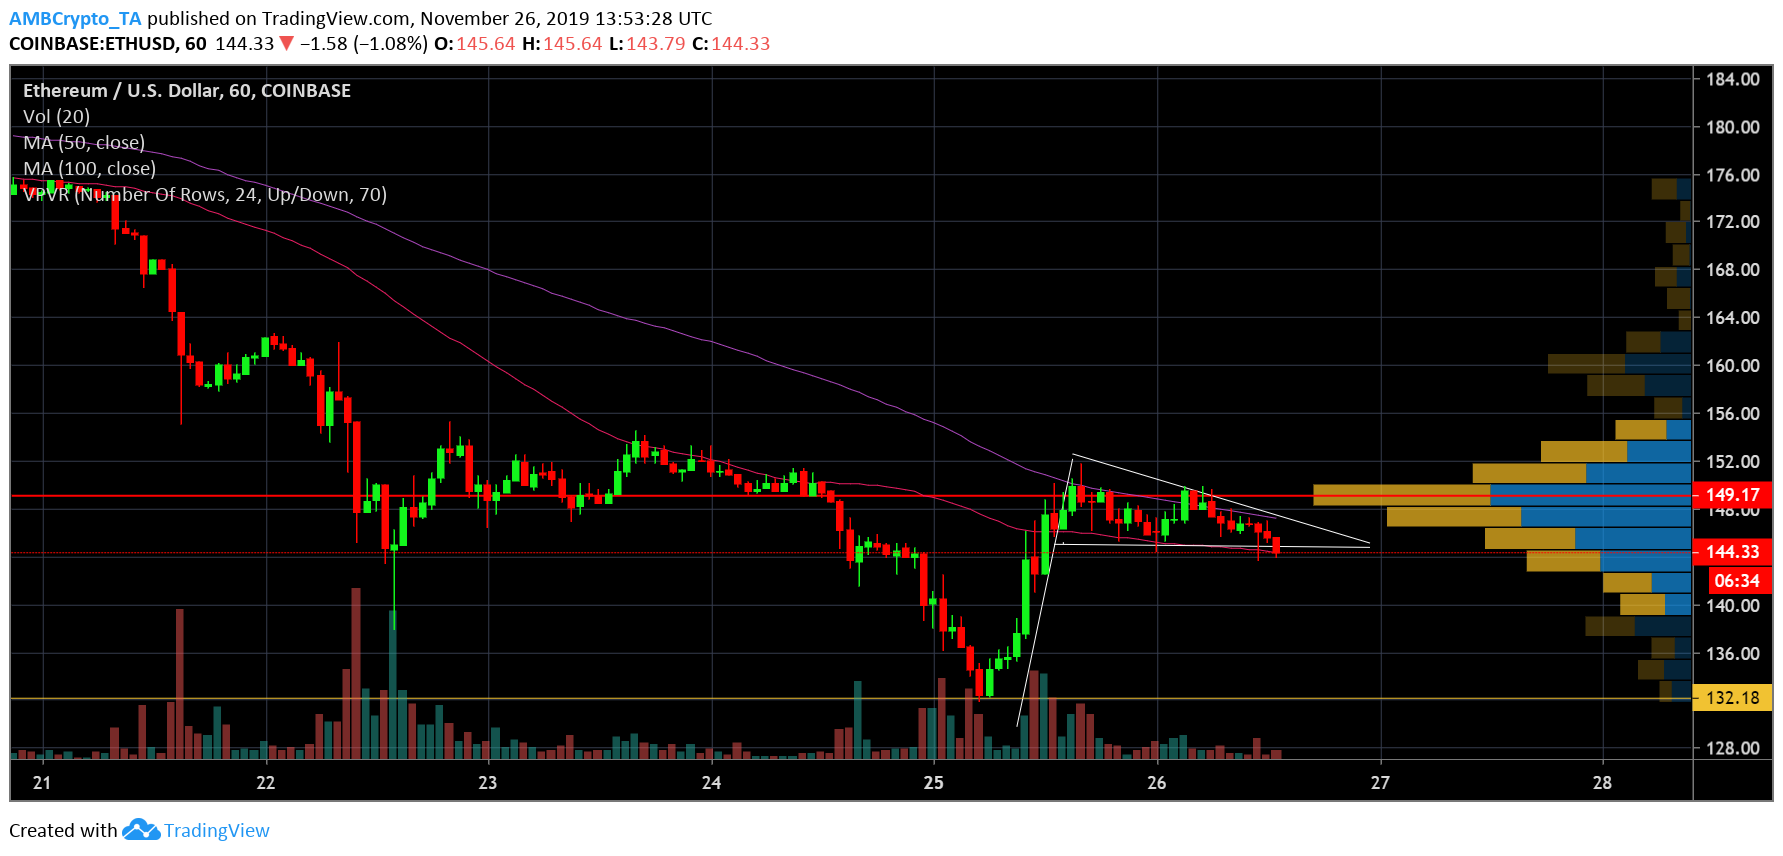
Ethereum’s short-term chart depicted the formation of a bullish pennant. The price made a sharp vertical climb on 25 November, following which the coin was in a brief period of consolidation. This was indicative of a potential price breakout to the positive upside in the near term. Further confirming the validity of the pattern was the volume on the hourly chart of Ethereum, which gradually declined during the time of the pattern formation.
The converging moving averages also pointed to a potential bullish phase for the coin, despite the fact that the 50 moving average was below the 100 moving average.
Volume Profile [VPVR] found that most of the trading volume occurred near the $148-$150 range. If the bullish trend persists, the coin could move nearer to the high volume nodes and breach its immediate resistance at $150. ETH’s support stood untested at $132.
Bearish indication
Source: ETH/USD on TradingView
Indicators took a bearish turn on the hourly-chart of the second-largest crypto by market cap. The MACD indicator also suffered a bearish cross-over and predicted a bearish phase for the coin in the near-term. The RSI indicator also exhibited a selling pressure among ETH investors.
Conclusion
Despite a bullish pennant formation, which indicated a continuation in the positive trend, indicators depicted a bearish picture for the coin. This could possibly mean a minor drop and bounce, subsequently leading to a bullish breakout and breach of its immediate resistance at $150.

