Analysis
Ethereum’s price may face obstructions on breach of ascending channel

Ethereum noted an upsurge of 8.44% in September, despite the wandering bears. The coin also noted a growth of almost 7% in October, but 100 moving average recently took over 50 moving average. With the 100 moving average resting under the 50 moving average, Ethereum noted a total gain of 57.14%, which elevated its price from $134.38 to $211.16%.
Apart from the price movement, the long-term chart reflected the bearish nature of Ethereum’s market.
Daily

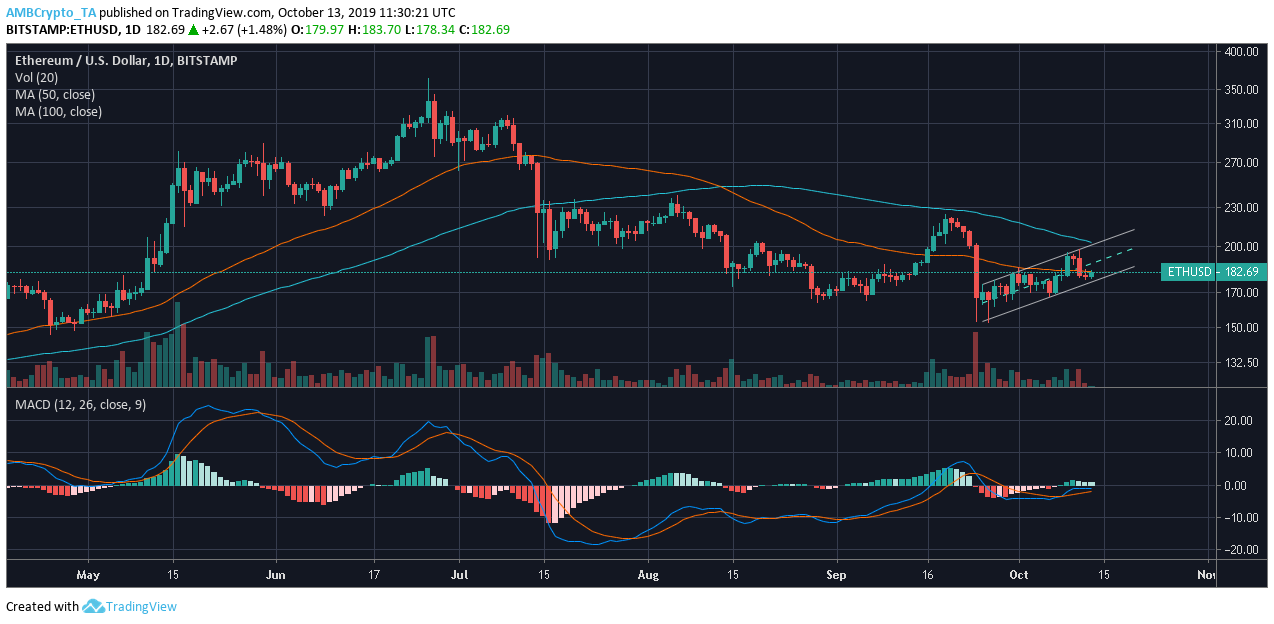
Source: ETH/USD on TradingView
The daily chart of the second-largest coin showed formation of the ascending channel that might take the rising price down. The pattern characterized by two rising slopes marked higher highs at $174.47, $181.97, and $196.30 and higher lows at $153.32, $169.01, and $177.88. As the price moves within the parallel lines, a downward breakout appeared imminent.
The market appeared extremely bearish as 50 moving average stood under 100 moving average and both averages rested above the candlesticks. Even though MACD line was above the signal line, conventionally a bullish market, the indicator also pointed toward reduced momentum. An approaching crossover may be in the offing, which might reverse the current trend into a bearish one.
Conclusion
Despite the rising price of the second-largest coin, a bearish market seems likely due to the ascending channel. The coin breaching the ascending channel may breakdown, devaluing the current price of Ethereum that stands at $183.34.