Analysis
Ethereum’s market contends with the bears as price falls on breach of descending triangle

Ethereum’s price noted an 8% hike in the month of September and has since, maintained its gradual growth in October too. The price of the second-largest coin has jumped by over 4% over the past week and was valued at $171.69, at press time. Even though the overall performance of the coin has been positive, there are some bears in the short-term for ETH to fight.
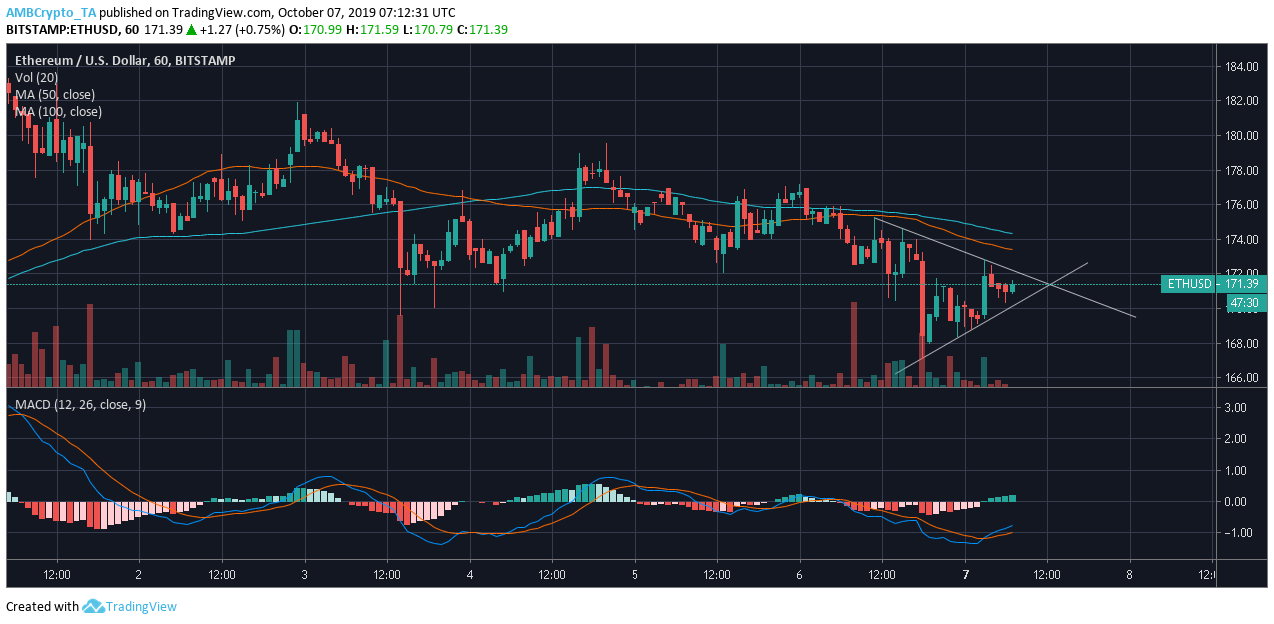
1-hour

Source: ETH/USD TradingView
The one-hour chart for ETH suggested the formation of a symmetrical triangle, characterized by two converging trend lines. These trend lines bridge the sequential peaks at $175.26, $174.56, and $172.83 and sequential troughs at $167.11, $168.38, and $169.37. As per the breakout of the pattern is concerned, the symmetrical triangle can breakout in either direction.
The 50 Moving average rested under the 100 moving average and the average aligned above the candlesticks, suggesting a bearish presence in the market. MACD line on the other hand, indicated a bullish trip as it overtook the signal line.
4-hour
Source: ETH/USD TradingView
ETH’s 4-hour chart pointed to the formation of a descending triangle, with the base marked by a horizontal trend line at $169.74, while another trend line marked the lower highs at $185.46, $179.38, and $1771.10. As per the nature of the descending pattern, a breakout towards the bearish side may be imminent.
The bears appear to have been let loose in the 4-hour chart, as the moving averages laid above the candlesticks and 100 moving average had a lead over the 50 moving average. MACD too affirmed the bearish market as it laid under the signal line.
Conclusion
Even though the one-hour chart did not confirm the direction of the breakout, the 4-hour chart pointed to the price of Ethereum taking a hit.

