
Ethereum’s price breached its strong resistance at $168 after the asset registered another spike on January 26th. The digital asset surged over 9 percent in the last 3 days, briefly touching the $173.40 mark and at press time, ETH was valued at $170.76.
Over the past 24-hours, ETH spiked over 2.34 percent and the trading volume has been above $11 billion as well.
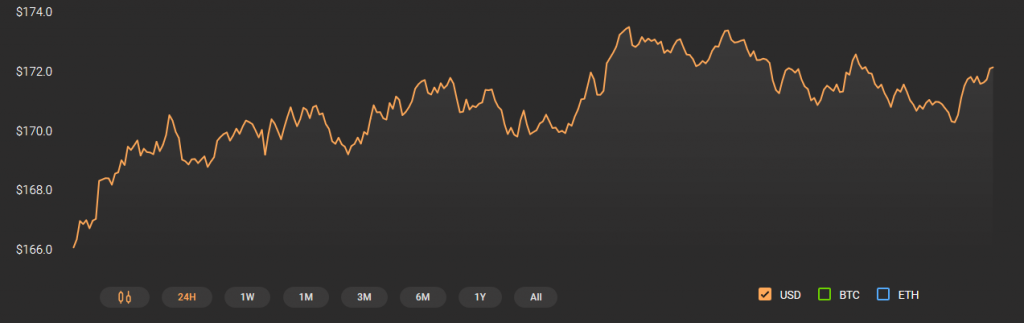
Source: Coinstats
1-hour Ethereum chart
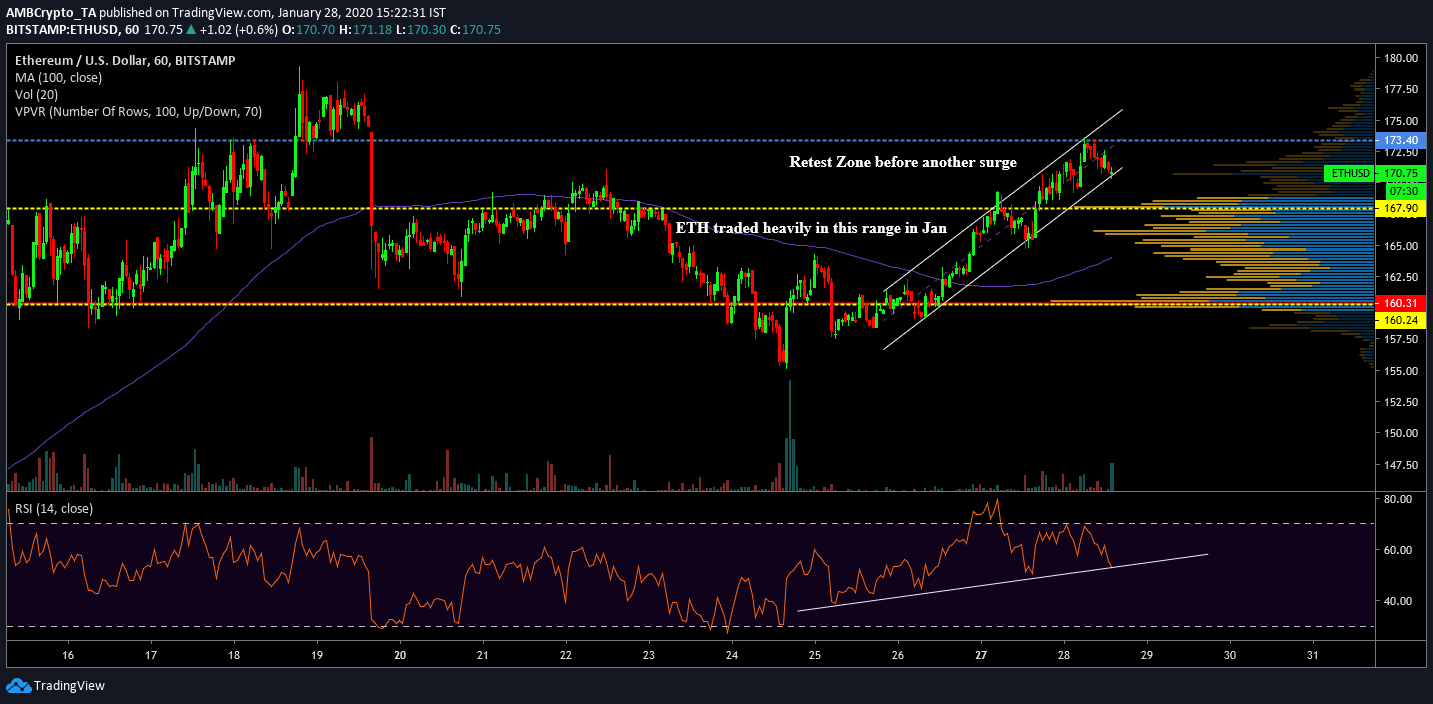
ETH/USD on Trading View
The short term chart of Ethereum exhibited the formation of an ascending channel that manifested over the last 3 days, and the valuation has continued to follow mediation between the trend lines. Over the course of the channel, the price managed to breach resistance at $167.90 again but maintained to consolidate above it for a significant period of time. The current valuation of ETH is a positive sign from the bullish perspective but an ascending channel suggested that a bearish pullback is imminent.
Considering how the market is panning out, a correction to support levels of $167 will be an ideal sign for Ethereum, before it undergoes another bullish outbreak.
VPVR indicator suggested that over the past 2 weeks, ETH traded the most at levels near $167. The Point-of-Control remained at $160.31, but Ethereum should re-test support levels at $167 over the next week.
The 100-Moving Average also underwent a trend reversal after the surge, as the price moved above the indicator on 26th January. The Relative Strength Index remained bullish as well.
ETH/BTC 4-hour chart
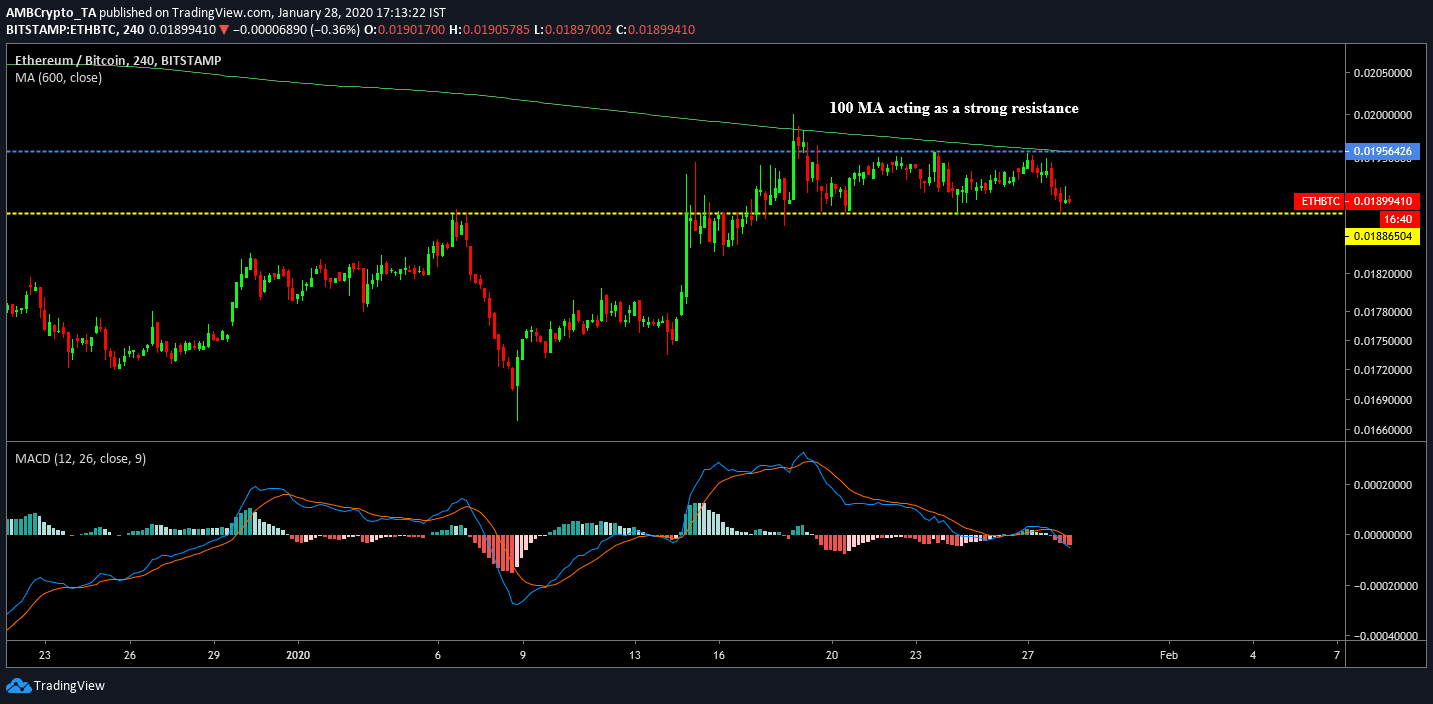
ETH/BTC on Trading View
ETH/BTC chart exhibited the sideways movement that has panned out since the hike on 14th January, and at press time, the 100-MA has held a strong resistance. The price has been below the moving average over the long term and it will most likely facilitate the ETH/BTC index to retest $0.0188 support line. MACD also indicated a bearish reversal, as the MACD signal crossed paths with the signal line.
Conclusion
Ethereum is currently in sync with the bullish sentiment but in order to avoid burnout, a correction down to $167 over the next few days should allow the 2nd largest asset to witness another hike to breach resistance at $174. As both the ETH/USD and ETH/BTC indicate a bearish turnaround over the short-term period, the probability for a correction is high.