
What appeared to be a huge upward momentum for the second-largest cryptocurrency by market cap, Ethereum’s rally to the psychological level of $300 was halted by several market corrections and the subsequent crash on March 12th. The coin has been trading in troubled waters for some time now. It was valued at $124.2 at press time and had lost 55.8% from its year high of $281.1.
Ethereum 1-Hour Chart:
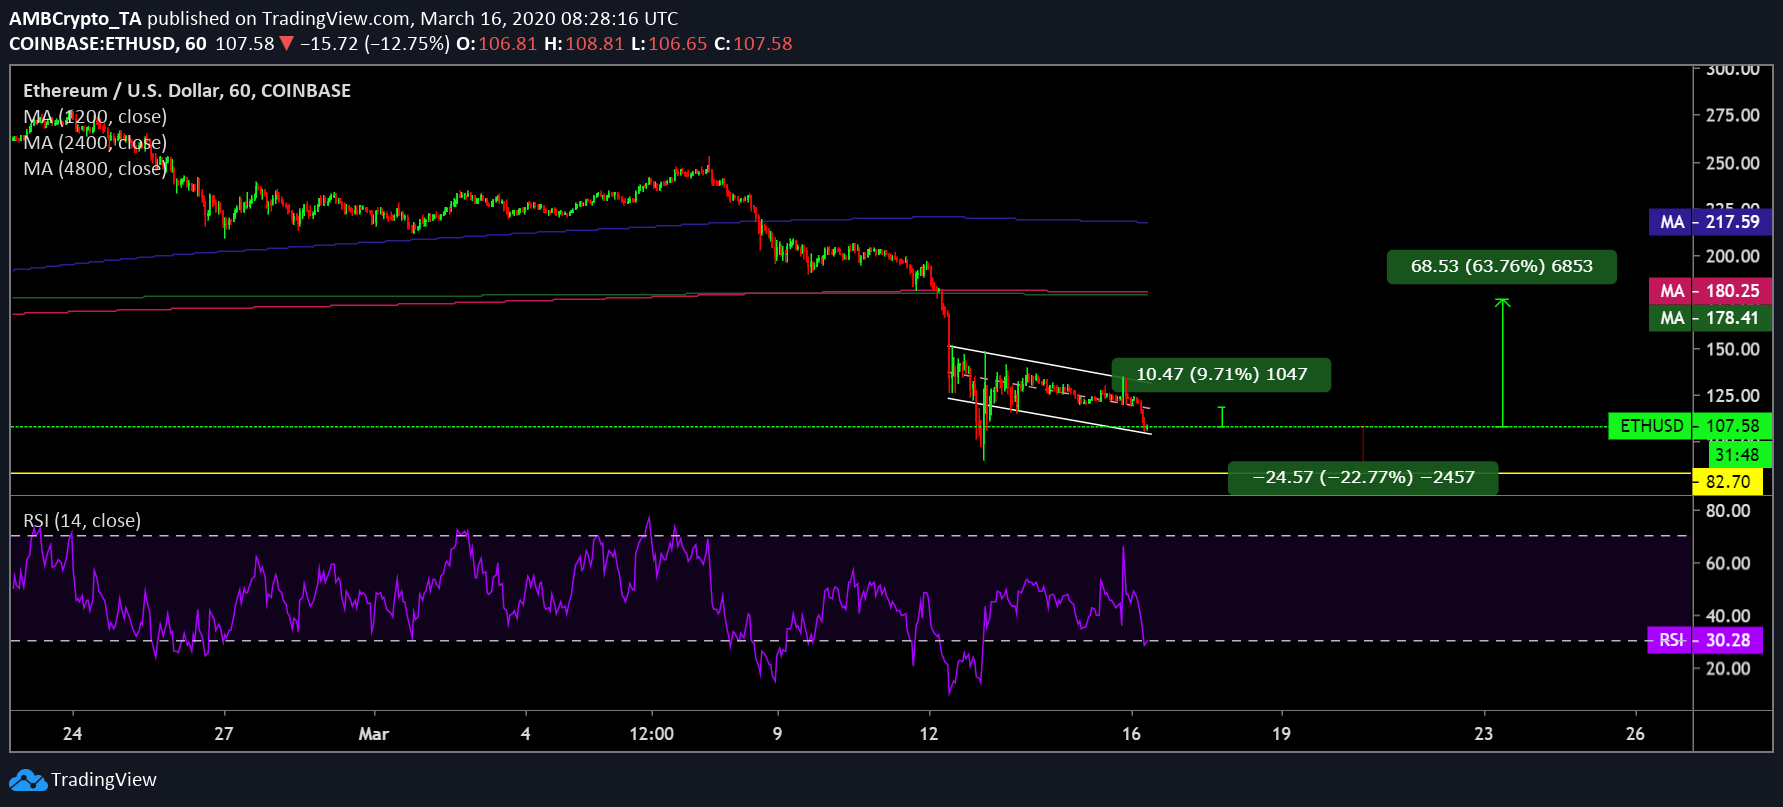
Source: ETH/USD on TradingView
The hourly chart for Ethereum exhibited formation of a descending channel. The price candles indicated a minor fake-out on 12th March when the collective market tumbled to new lows. However, the price went up on 13th March and since then the price has been mediating within the descending channel. This pattern indicated the much-anticipated bullish breakout in the near term.
A price revival on the cards?
If the breakout to the upside materializes, the immediate resistance for the ETH price candles stood at the center-line of the pattern at $118, meaning a surge of 9.71% from the price at press time. In case of an extremely bullish scenario, ETH could find its price being resisted at $177. This is the point where there is a confluence of 100 as well as the 200 daily moving averages.
ETH underwent a golden cross on 16th February this year. Since then, it has been hovering above both the 100 as well as 200 daily moving averages. This indicated a bullish sentiment in the ETH-market.
However, the 100 daily moving average and the 200 daily moving average sustained a bearish crossover on 8th March and this has been continuing ever since. The 100 DMA-200 DMA gauge has not widened and exhibited a mild bullish sentiment.
Additionally, the selling pressure has been increasing across the crypto market, and for ETH, RSI indicator was in the oversold region. However, RSI managed to stay above the lower band, this hinted at a bullish revival. In an unlikely scenario of a breakout to the downside, ETH could retest December 2018 lows at $82.
Ethereum-Bitcoin correlation:
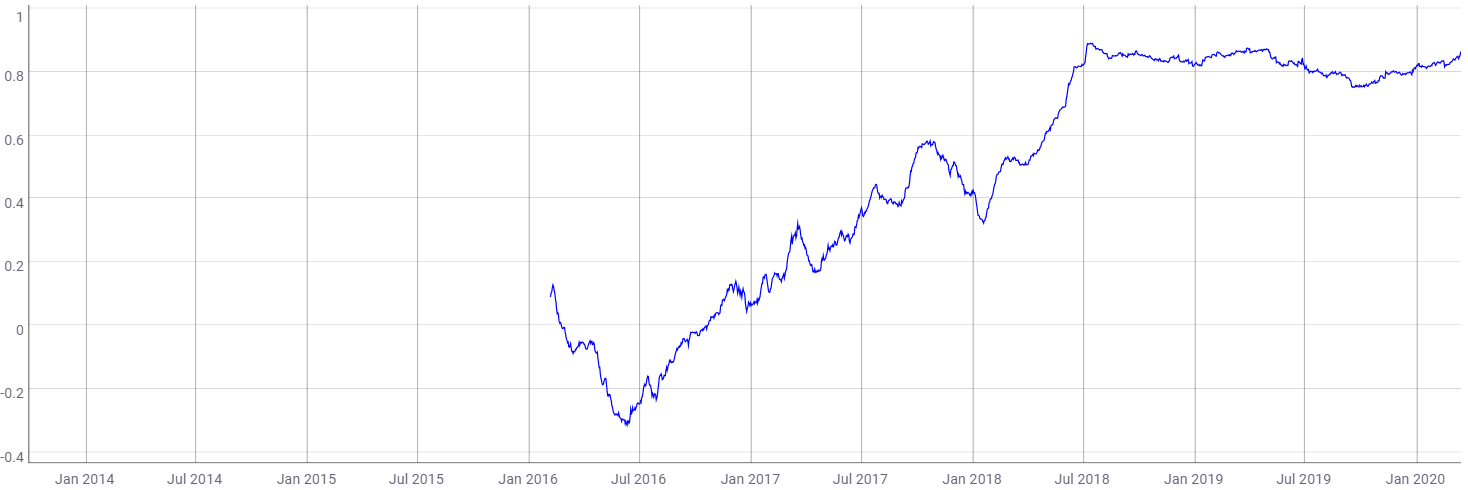
Source: CoinMetrics
Ethereum has closely followed Bitcoin’s price. The BTC-ETH correlation on the chart surged to its peak in July 2018. It spiked again after a minor decline and has been on the rise ever since. According to CoinMetrics, the BTC correlation coefficient stood at 0.86.
If Bitcoin’s price sees another bullish price trend, Ethereum could potentially mimic the king coin’s price movement to breach key-levels. However, if Bitcoin undergoes another fall, Ethereum’s price could also follow this trend to drop to new lows.
Conclusion:
A bullish breakout appeared to be on the cards with the formation of the descending channel and the moving averages favoring the bullish trend. The target points in case of a bullish trend stood at $118 and $177. However, in case of a trend reversal, the coin could find itself testing support near its December 2018 lows.