Ethereum’s consolidation under $190 may continue

Over the past few days, Ethereum was exhibiting a sideways movement in the chart. The altcoin continued to lose valuation after the slump on 24th September but significant bullish signs were prominent in the short-term analysis. At press time, Ethereum was valued at $173.88.
1-Hour Chart

Source: ETH/USD at Trading View
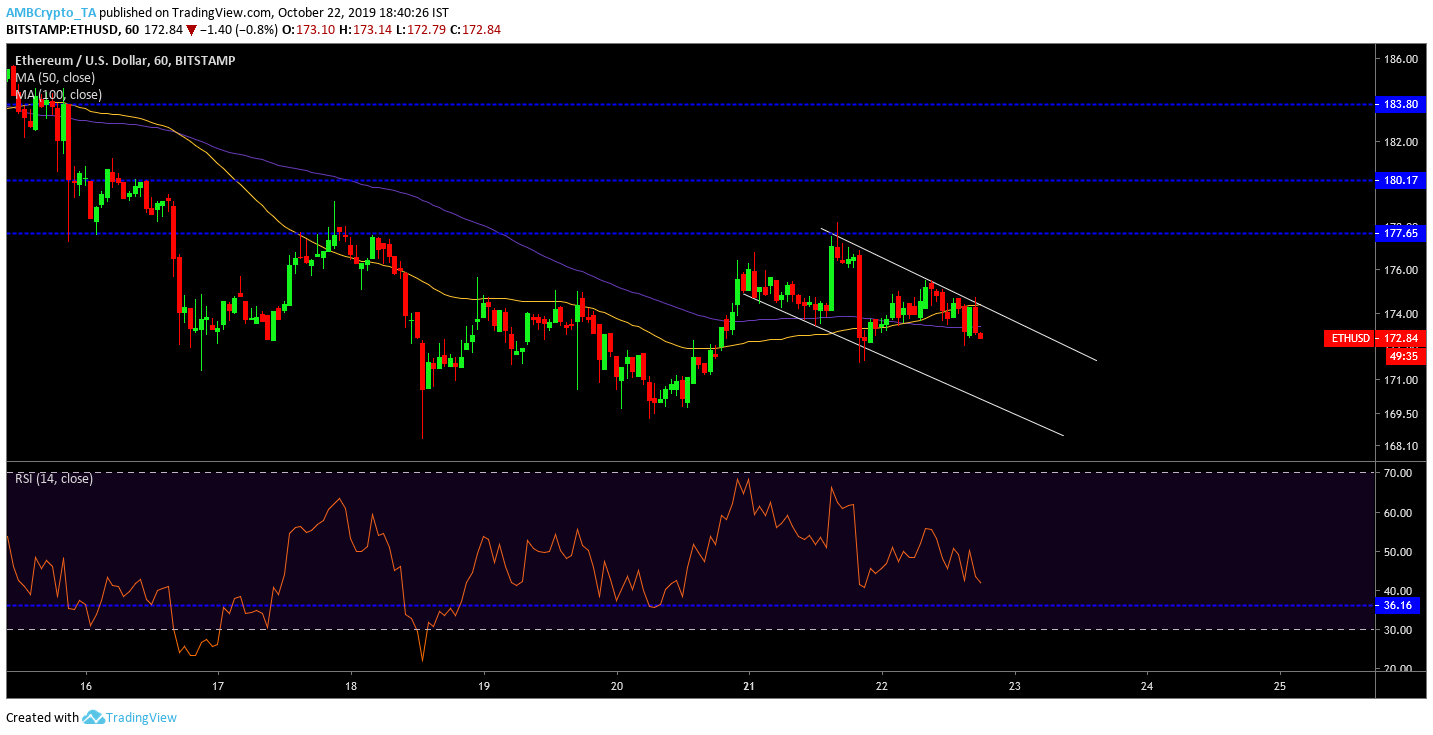
Ethereum’s price had registered a decline of over 2 percent in the past 36 hours but the price movement led to the formation of a descending channel. The price tested the trend lines in the chart as the valuation continued to slump. However, the pattern formation suggested that Ethereum should recover some of its valuation via an impending bullish break. The break should propel ETH to re-test the resistance at $177.65 and then consolidate higher for that period of time.
The 50-Moving Average also completed a bullish crossover with the 100-Moving Average, improving the possibility of a bullish break.

ETH/USD at Trading View
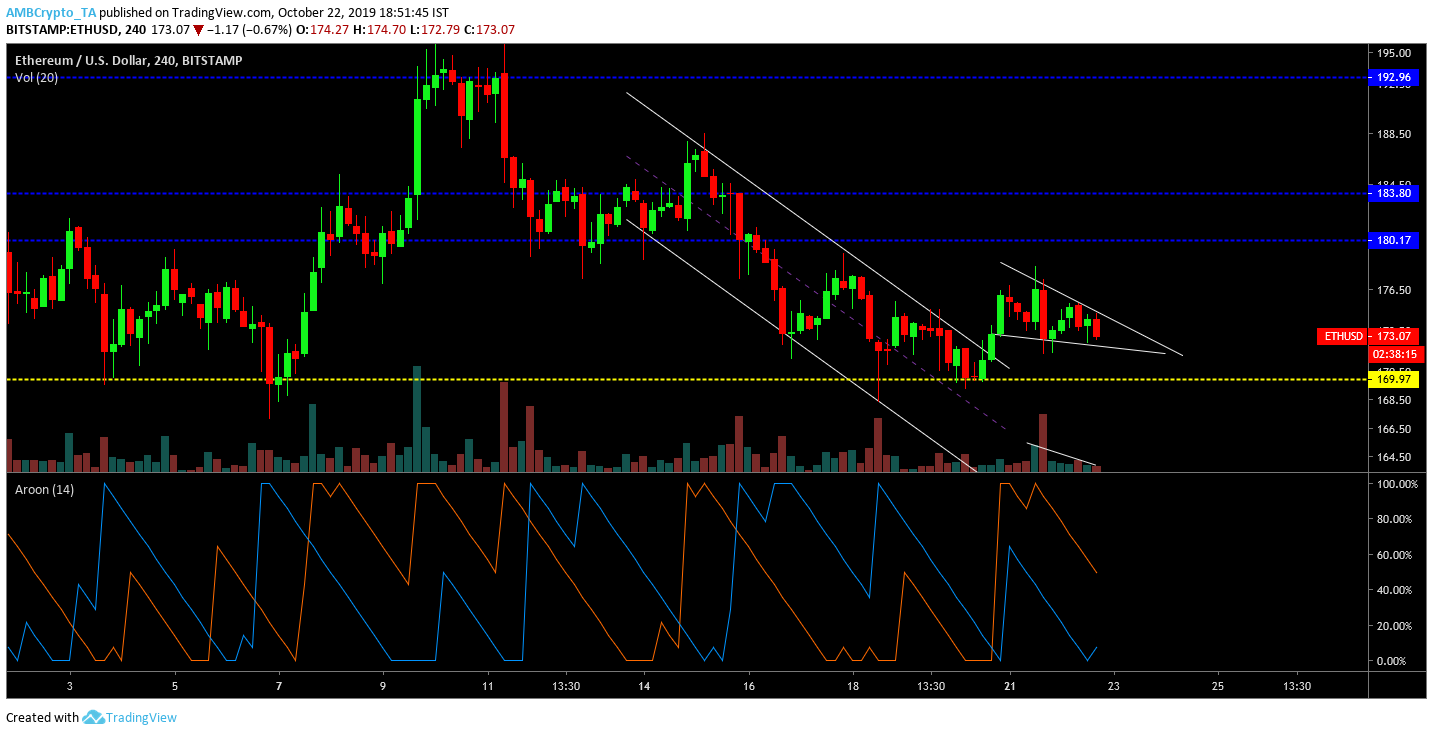
Ethereum’s 4-hour chart presented more clarity. According to the analysis, a descending channel was breached by ETH and at press time, it exhibited a falling wedge pattern. The falling trade volume confirmed the validity of the pattern. A falling wedge pattern indicates a similar bullish breakout but there may be a lack of significant momentum.
Aroon indicator suggested that bearish momentum was on a decline at press time and bullish signs had started to pick up however, the momentum was significantly weak.
Conclusion
After 3-weeks of consolidation under the $190 mark, Ethereum may continue to consolidate below the range but a bullish breakout should see the valuation re-test immediate resistance at $180.17 and $183.80.
