Analysis

Ethereum’s consolidating price may witness a bullish break following the formation of descending channel
Posted:
| Last updated: September 6th, 2019

Since the end of June, Ethereum’s price has been progressively declining as the bulls have failed to pick up pace after their 3-month run. ETH’s valuation dipped below the support of 239.43 and at press time, it was acting as a major resistance. Over the past week, the valuation witnessed another slump down to $163.9, but signs of recovery were found in the charts. Ethereum experienced a growth of 2.94 percent over the past 24 hours.
4-hour chart
Source: Trading View
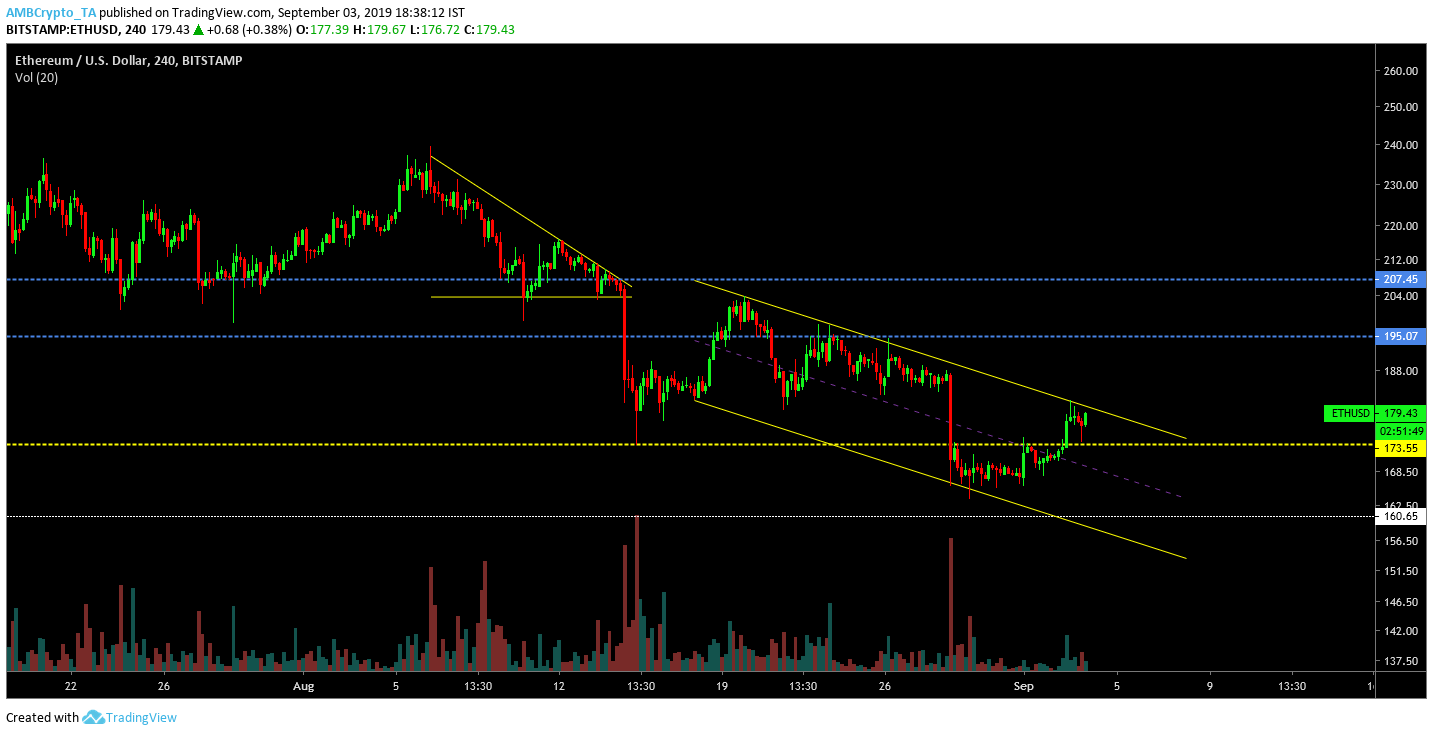
On the 4-hour chart, it was observed that a prominent descending triangle pattern was taking shape. The price movement of ETH adhered to the pattern’s line and an expected bearish breakout was recorded on 14 August. The price took a hit and the valuation dropped down to $181.44. The long-term support of $207.45 had turned into major resistance in the charts.
Now, at press time, Ethereum’s ardent followers can afford to be optimistic about an impending price pump as a prominent descending channel was transpiring in the market. The lowers highs formed in the pattern bounced off the trend line a few times and the decreasing volume conform to the validity of the pattern. An impending bullish breakout could rally the price to retest the resistance at $195.07 and further momentum may assist Ethereum in breaching the $200 mark.
6-hour chart
Source: Trading View
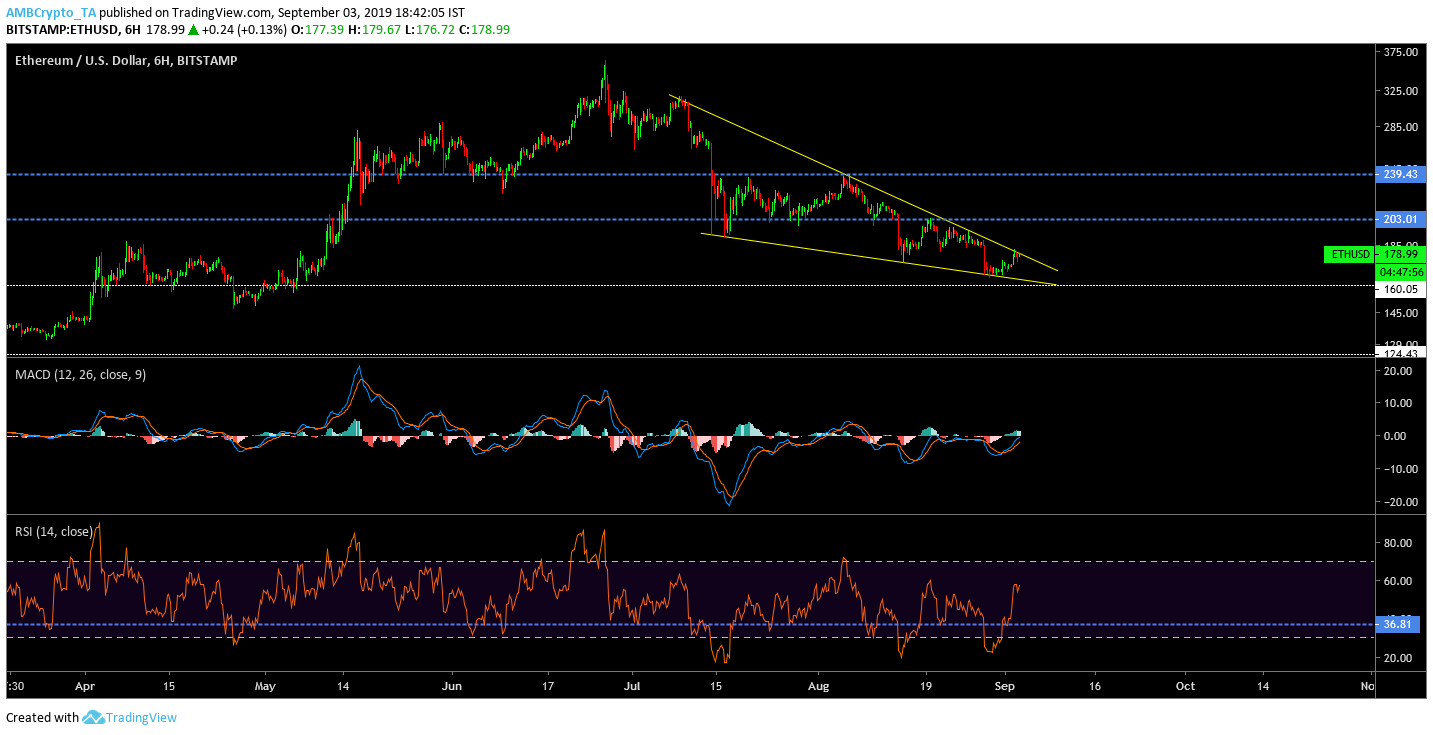
The 6-hour chart for Ethereum was also indicative of a bullish breakout as the pattern formation of a falling wedge was evident. The analysis indicated that the price might decline a little further till $160, but a breakout should breach the $200 mark in the next two weeks.
The MACD indicator also implied a bullish trend for the coin as the blue line completed a crossover with the red line. The Relative Strength Index or RSI suggested that traders were back in the market as the line hovered over the 60-mark.
Conclusion
After a week of consolidation under $180, the trend may flip soon for Ethereum as the 4-hour chart and 6-hour chart displayed prominent patterns which suggested a bullish breakout for the 2nd largest virtual asset in the market.