Analysis
Ethereum’s breakout from flag pattern could drop price to $127

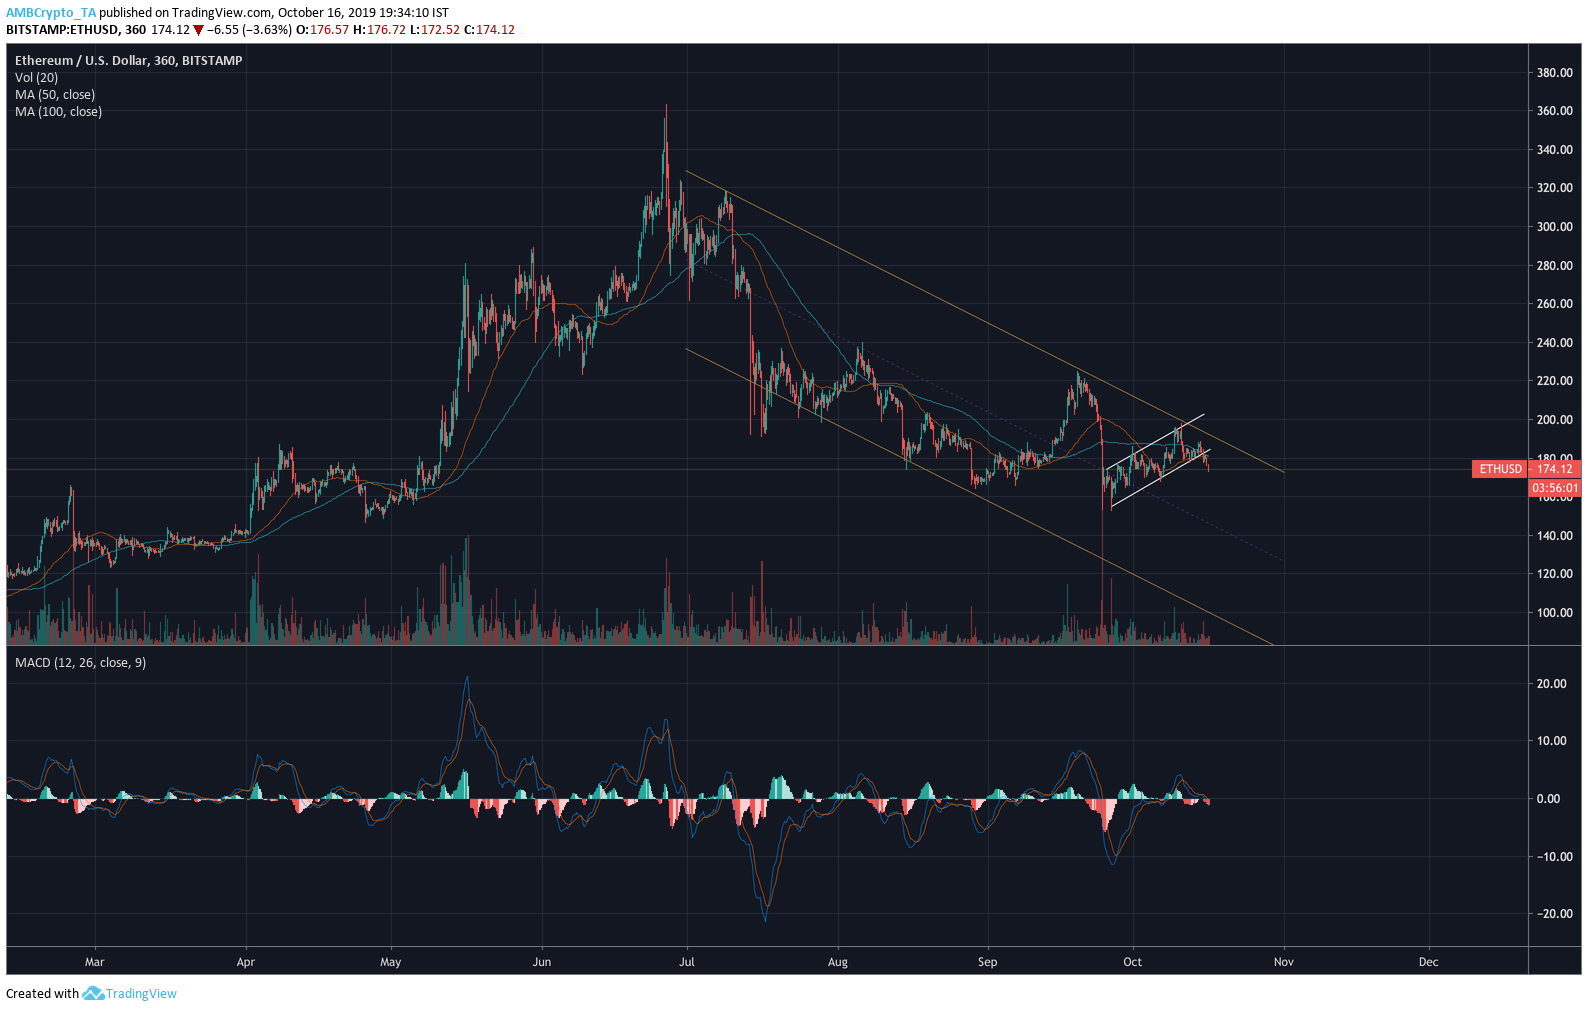
Ethereum has recovered considerably from its drop last month, and was valued at around $173, at the time of writing. The Ethereum network’s native token, ETH, also ranks 2nd in the list of the world’s largest cryptocurrencies, with a market cap of almost $19 billion and a daily trading volume of nearly $8 billion, according to CoinMarketCap. However, a depreciation of close to 4.8% over a 24 hour period and its movement through a descending channel over the past few months could suggest that Ethereum is in for a bearish market in the near future.
6-hour chart

Source: ETHUSD on TradingView
The 6-hour chart for ETH showed that the price trend had entered into a tight bearish flag on the 25th of September. A few days ago, the trend broke out of the bearish flag, almost exactly 3 weeks after it entered the pattern. Generally, patterns like these which extend longer than 3 weeks are considered to be rectangles or channels. This breakout, combined with the decreasing volume trend, makes it very likely that this is, indeed, a bearish flag pattern.
For this pattern, breakout occurs downwards 60% of the time. In this case, we can see that the price has already broken out below the lower trend line, indicating that ETH could drop further. Over a longer period, the price appears to be moving through a descending channel, also indicating a further drop to a lower price.
One scenario is where the price trend moves down to $145, the central line of the descending channel, after which it will bounce back, possibly up to $190 over the next couple of weeks. The other scenario is where ETH breaks through the $145 mark and falls to the range between $125 and $130 at the lower trend line.
This is a decision it will have to make within the next week or so. With MACD offering a bearish crossover and the 50 and 100 moving averages moving above the price trend in either scenario, a bearish market for Ethereum looks likely in the near future.

